We’re here for you
Arrange an appointment for a non-binding consultation or if you have any questions, just give us a call.

![]()
header.search.error
UBS Real Estate Market Study
Development of real estate prices in Switzerland: What are the forecasts for the real estate market? Which factors are decisive?
Content:

Residential property became much more expensive in the final quarter of 2025 Year-over-year home prices rose by 4.1%, while consumer prices stagnated.
The increase in rents on the rental housing market has slowed considerably. Asking rents are currently still 1.2% up on the previous year. The momentum of existing rents has also slowed, rising by 1.4% within a year.
UBS Swiss Real Estate Bubble Index in the 4th quarter of 2025: moderate
In the fourth quarter of 2025, the UBS Swiss Real Estate Bubble Index rose from 0.27 to 0.48 index points. This was the strongest quarterly increase since 1989. The risk of a real estate bubble is still classified as moderate.
What is the UBS Real Estate Bubble Index and how is it calculated?
The UBS Swiss Real Estate Bubble Index shows the risk of a real estate bubble – a significant overvaluation of real estate and the likelihood of an imminent price drop – on the Swiss real estate market. UBS economists use a model with different subindices to calculate the bubble index:
Depending on the current index value, the real estate bubble risk is divided into the following four categories:

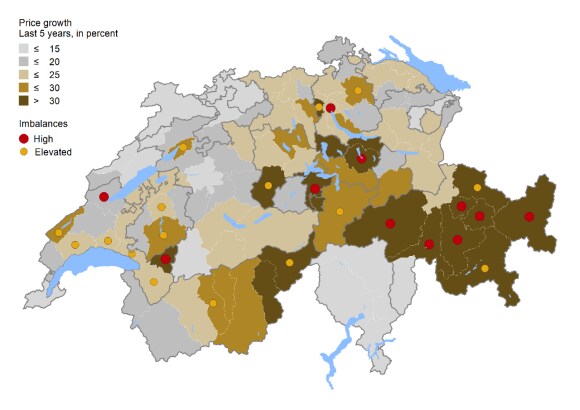
The risk map shows in which municipalities the real estate market is at risk of overheating
The map shows price developments over the last five years for all 106 Swiss economic regions, as well as an indication of regional risk based on the development of the price-to-income and price-to-rent ratios.

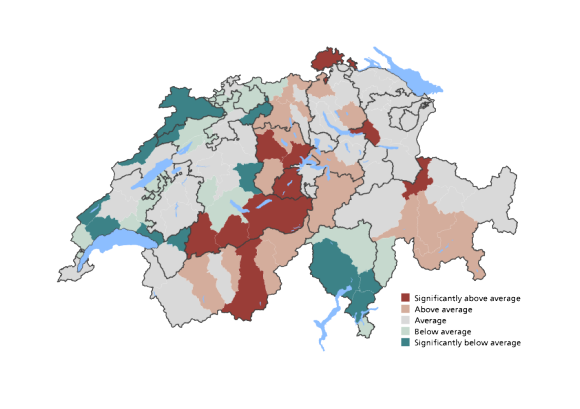
Despite attractive financing conditions, a slowdown in home price increases is expected in the coming quarters. Economic growth in Switzerland is at risk of losing further momentum. Rising uncertainty regarding jobs and incomes is likely to negatively impact demand for homeownership. For the years 2026 and 2027, we anticipate a slight slowdown in price increases to 2 to 3 percent due to the strained affordability of homeownership. However, not all regions are likely to benefit equally from value gains.
Regional price outlook
The best conditions for above-average price increases - measured by local demand surplus, momentum, and relative price level in the residential property market - are found in Upper Valais, the Bernese Oberland, Chur, Lucerne, and Schaffhausen. Our analyses indicate below-average price development around Lake Geneva, along the Jura Arc, and in Northwestern Switzerland.


The facts about your preferred municipality
Do you want to understand how property prices or population levels have changed in a municipality? Or how the location is perceived in general? How high are taxes? The UBS municipality guide is free of charge and answers all your questions.
Arrange an appointment for a non-binding consultation or if you have any questions, just give us a call.
Disclaimer