
We’re here for you
Arrange an appointment for a non-binding consultation or if you have any questions, just give us a call.

header.search.error
Which municipalities offer attractive living conditions for families? The “UBS Residential Attractiveness Indicator 2026” rates over 2,000 municipalities based on 38 criteria. Discover which ones are leading the way in your region.


Choosing the right place to live is an important decision. Especially when it comes to finding a place where you can feel happy in the long term, and build a home for yourself and your family. Whether a municipality is perceived as attractive depends on numerous factors: from accessibility to job opportunities, leisure opportunities, and the cost of living.
The Residential Attractiveness Indicator (RAI) therefore evaluates the more than 2,000 municipalities in Switzerland based on 38 measurable criteria, and identifies which places offer the most attractive living conditions for families with two children. The focus is on households that live in rental accommodation.
Good to know: About 70% of all moves in Switzerland take place within a radius of less than 10 kilometers. For this reason, the Residential Attractiveness Indicator does not compare all municipalities throughout Switzerland with one another, but rather places within the same region.
Top 3 municipalities per region for a family with a medium income
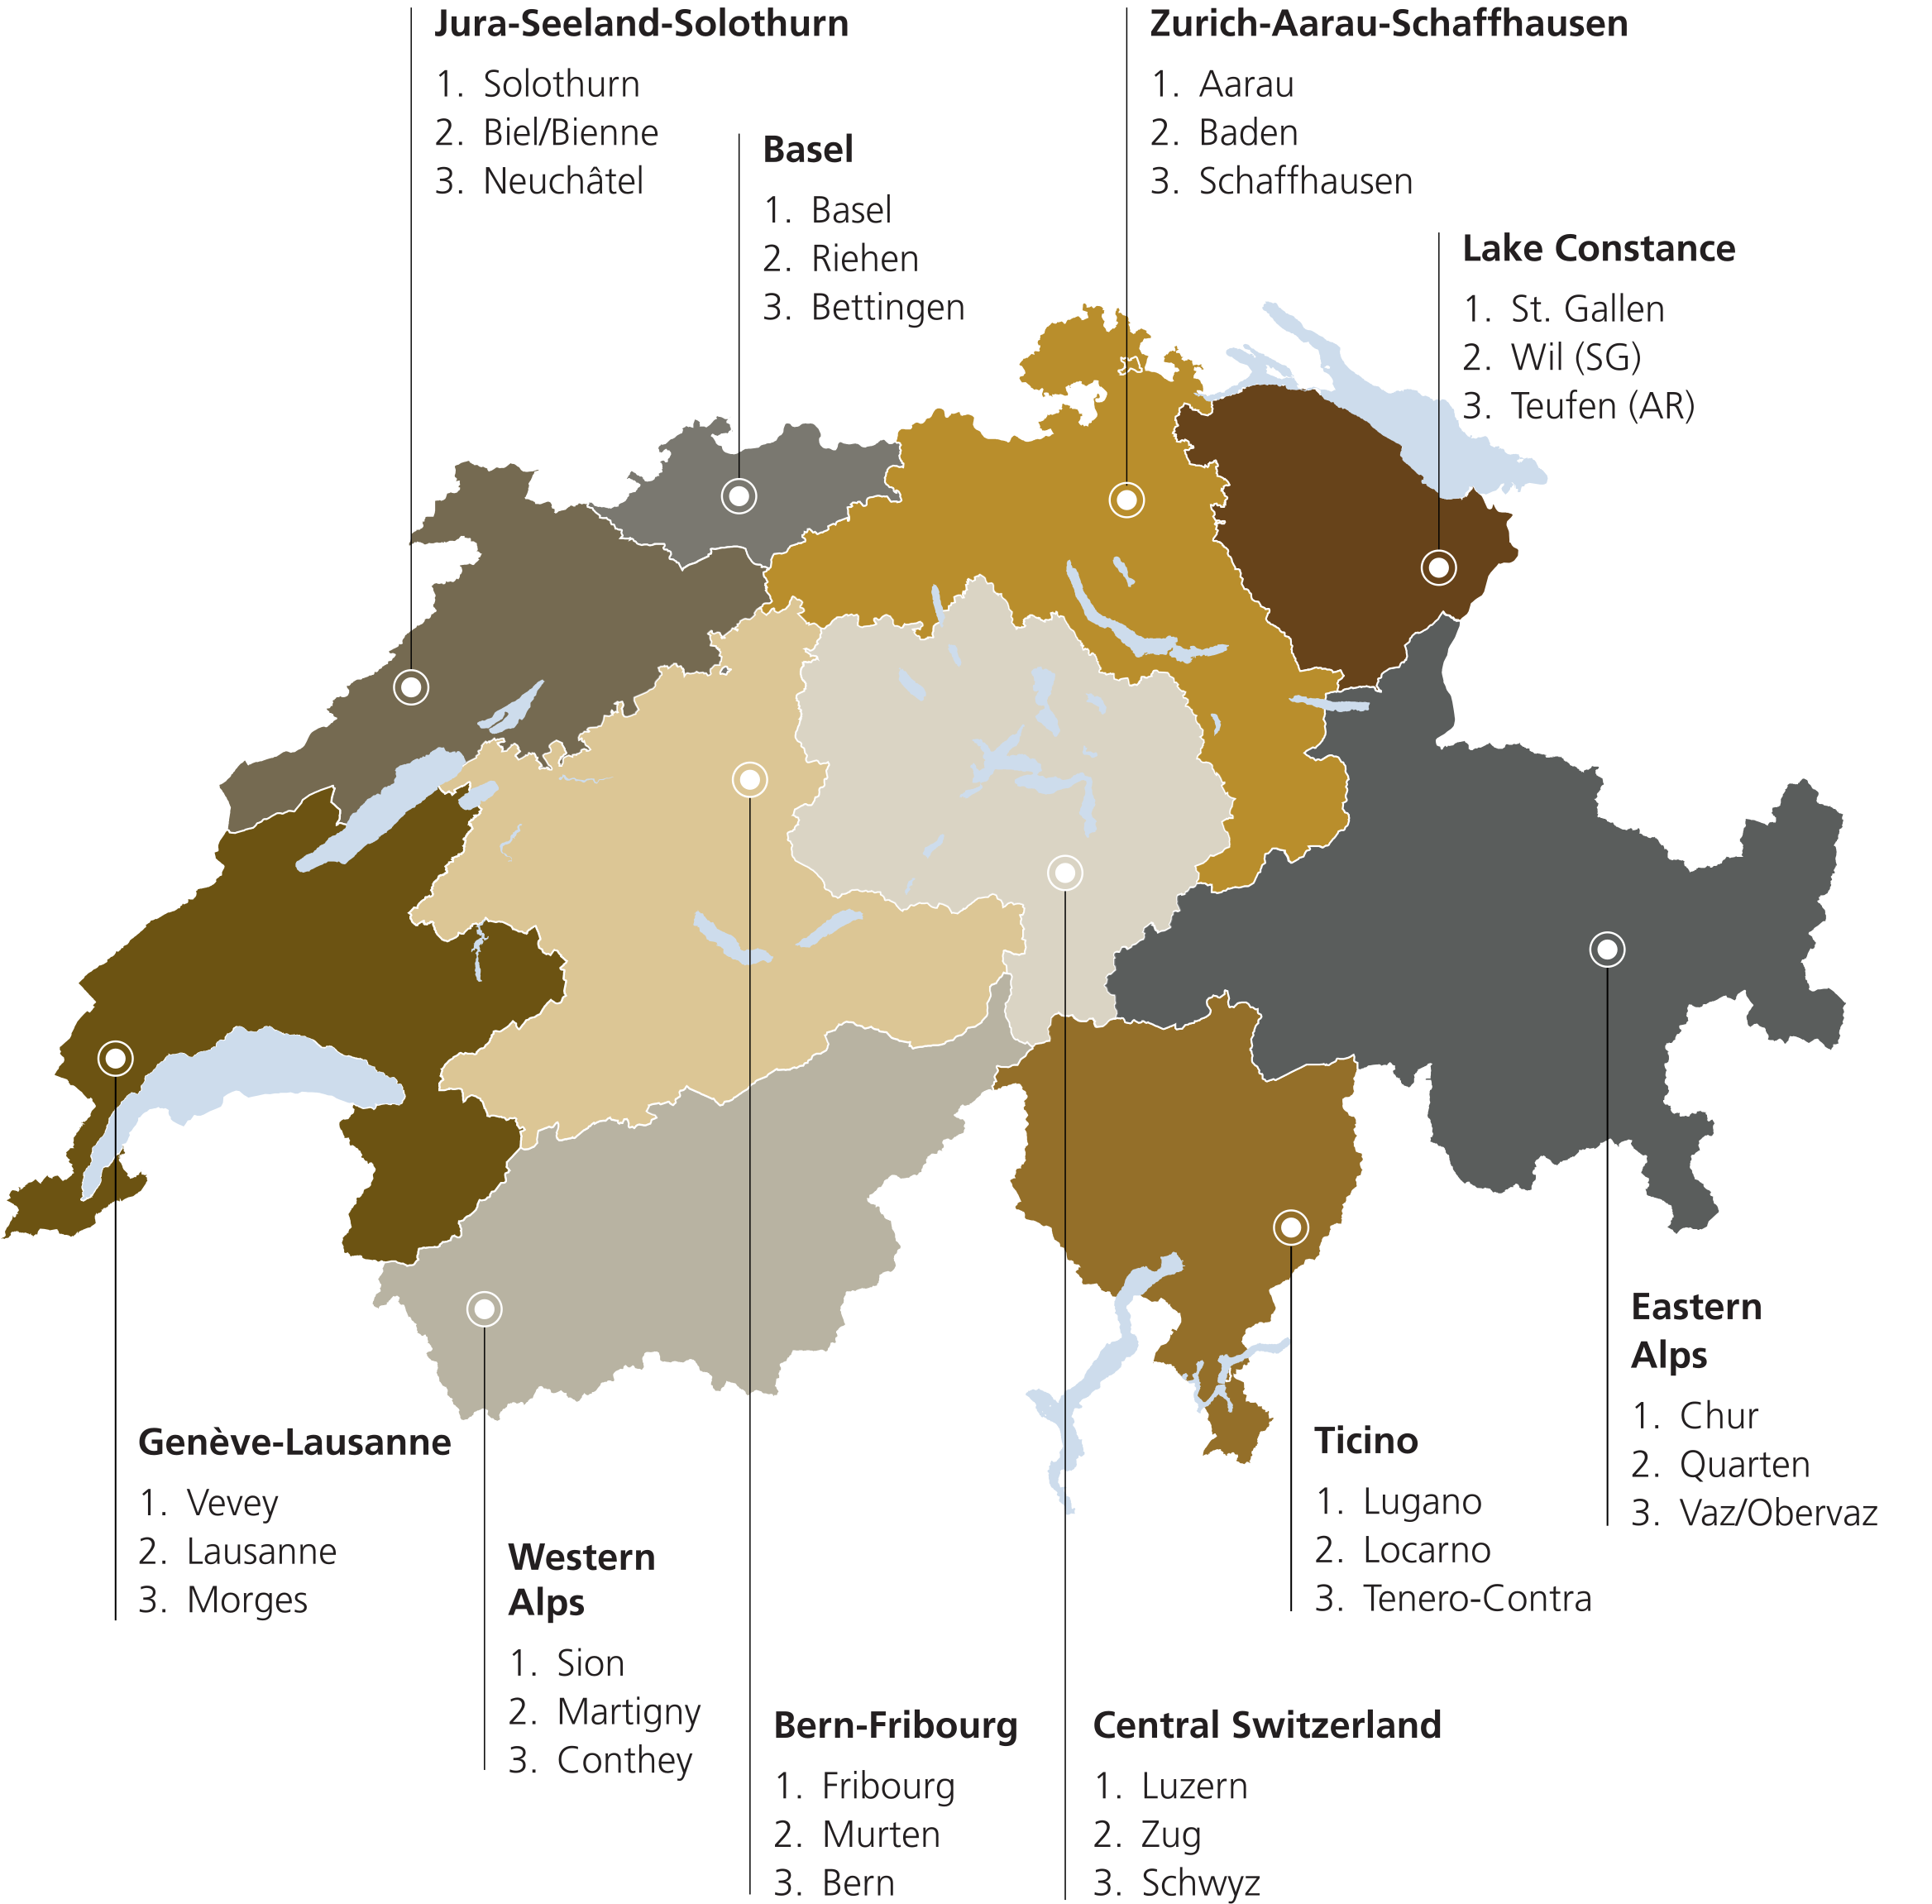
Source: UBS
| Rank | Middle income | Low income | High income |
|---|---|---|---|
1 | Basel (BS) | Basel (BS) | Basel (BS) |
2 | Riehen (BS) | Riehen (BS) | Riehen (BS) |
3 | Bettingen (BS) | Oberdorf (BL) | Bettingen (BS) |
4 | Sissach (BL) | Sissach (BL) | Magden (AG) |
5 | Rheinfelden (AG) | Liestal (BL) | Binningen (BL) |
6 | Binningen (BL) | Münchenstein (BL) | Bottmingen (BL) |
7 | Magden (AG) | Reigoldswil (BL) | Rheinfelden (AG) |
8 | Münchenstein (BL) | Waldenburg (BL) | Sissach (BL) |
9 | Liestal (BL) | Rheinfelden (AG) | Gipf-Oberfrick (AG) |
10 | Bottmingen (BL) | Kienberg (SO) | Münchenstein (BL) |
How well do the individual municipalities within their region fare? The map highlights the differences: Municipalities shaded in dark green are among the most attractive places to live for a tenant household when compared regionally. Municipalities shaded in gray, on the other hand, have below-average attractiveness when compared regionally.
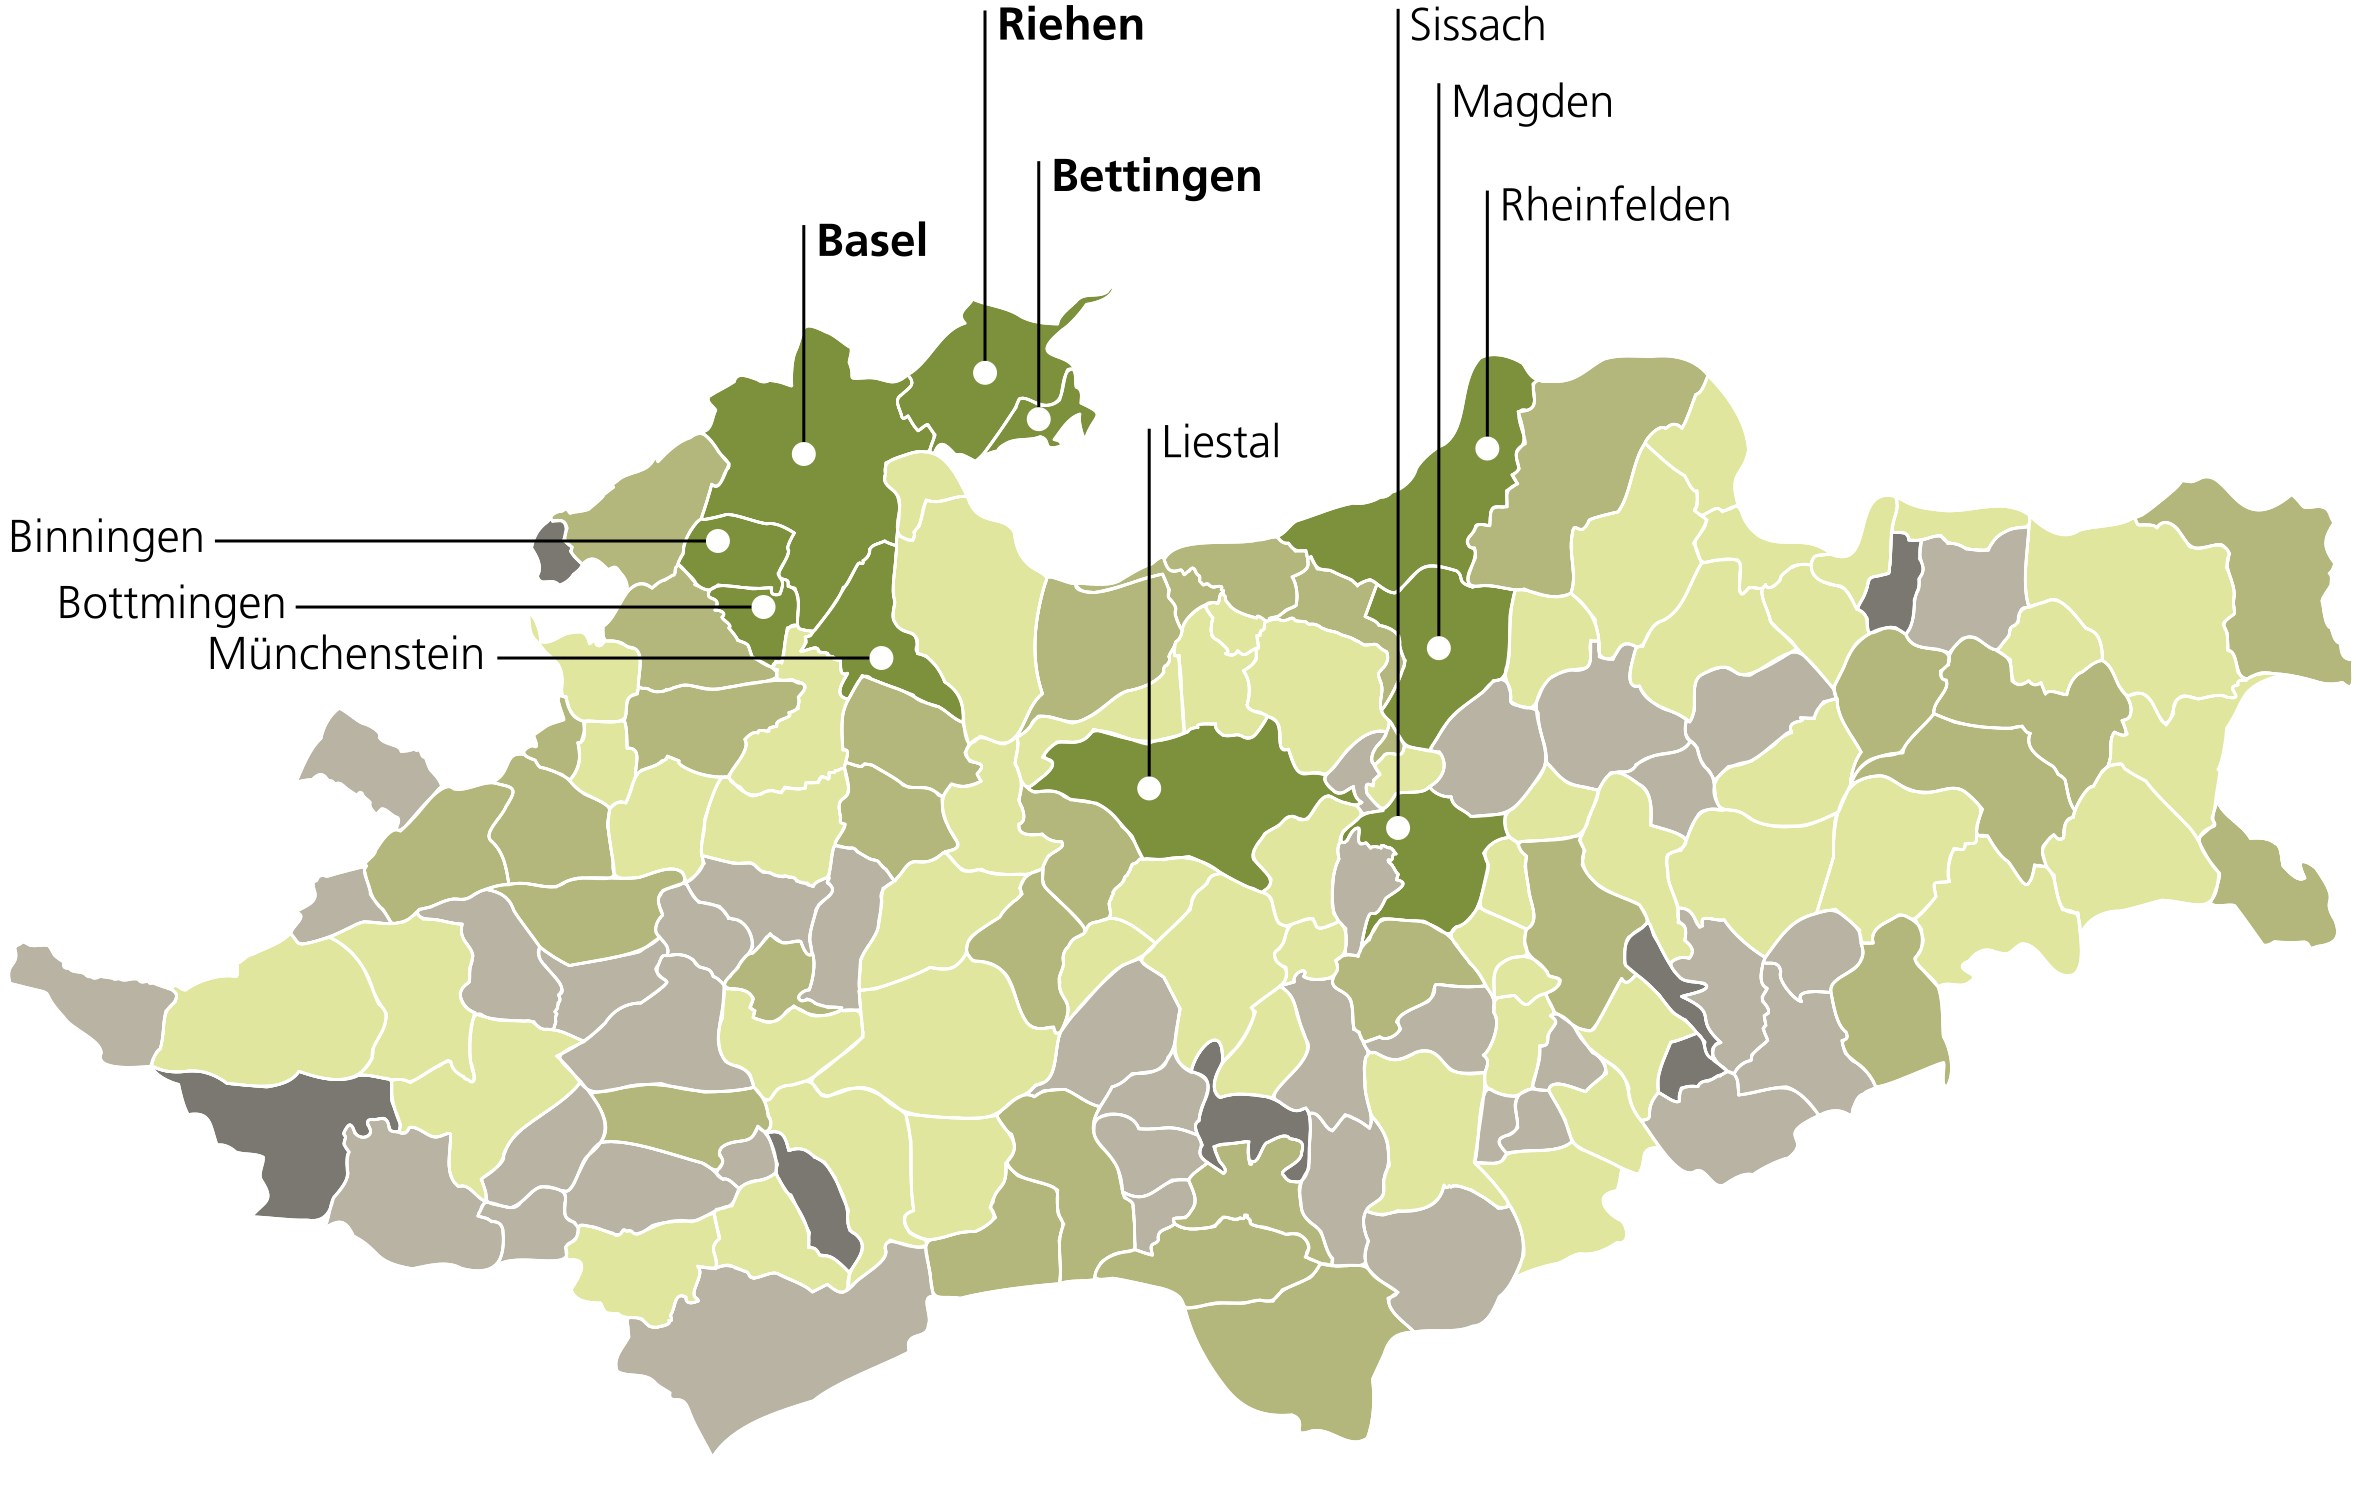

| Rank | Middle income | Low income | High income |
|---|---|---|---|
1 | Fribourg (FR) | Fribourg (FR) | Fribourg (FR) |
2 | Murten (FR) | Murten (FR) | Murten (FR) |
3 | Bern (BE) | Düdingen (FR) | Bern (BE) |
4 | Thun (BE) | Plaffeien (FR) | Thun (BE) |
5 | Interlaken (BE) | Langenthal (BE) | Meyriez (FR) |
6 | Düdingen (FR) | Thun (BE) | Hilterfingen (BE) |
7 | Langenthal (BE) | Granges-Paccot (FR) | Wohlen bei Bern (BE) |
8 | Granges-Paccot (FR) | Interlaken (BE) | Interlaken (BE) |
9 | Wohlen bei Bern (BE) | Bern (BE) | Düdingen (FR) |
10 | Hilterfingen (BE) | Rechthalten (FR) | Granges-Paccot (FR) |
How well do the individual municipalities within their region fare? The map highlights the differences: Municipalities shaded in dark green are among the most attractive places to live for a tenant household when compared regionally. Municipalities shaded in gray, on the other hand, have below-average attractiveness when compared regionally.
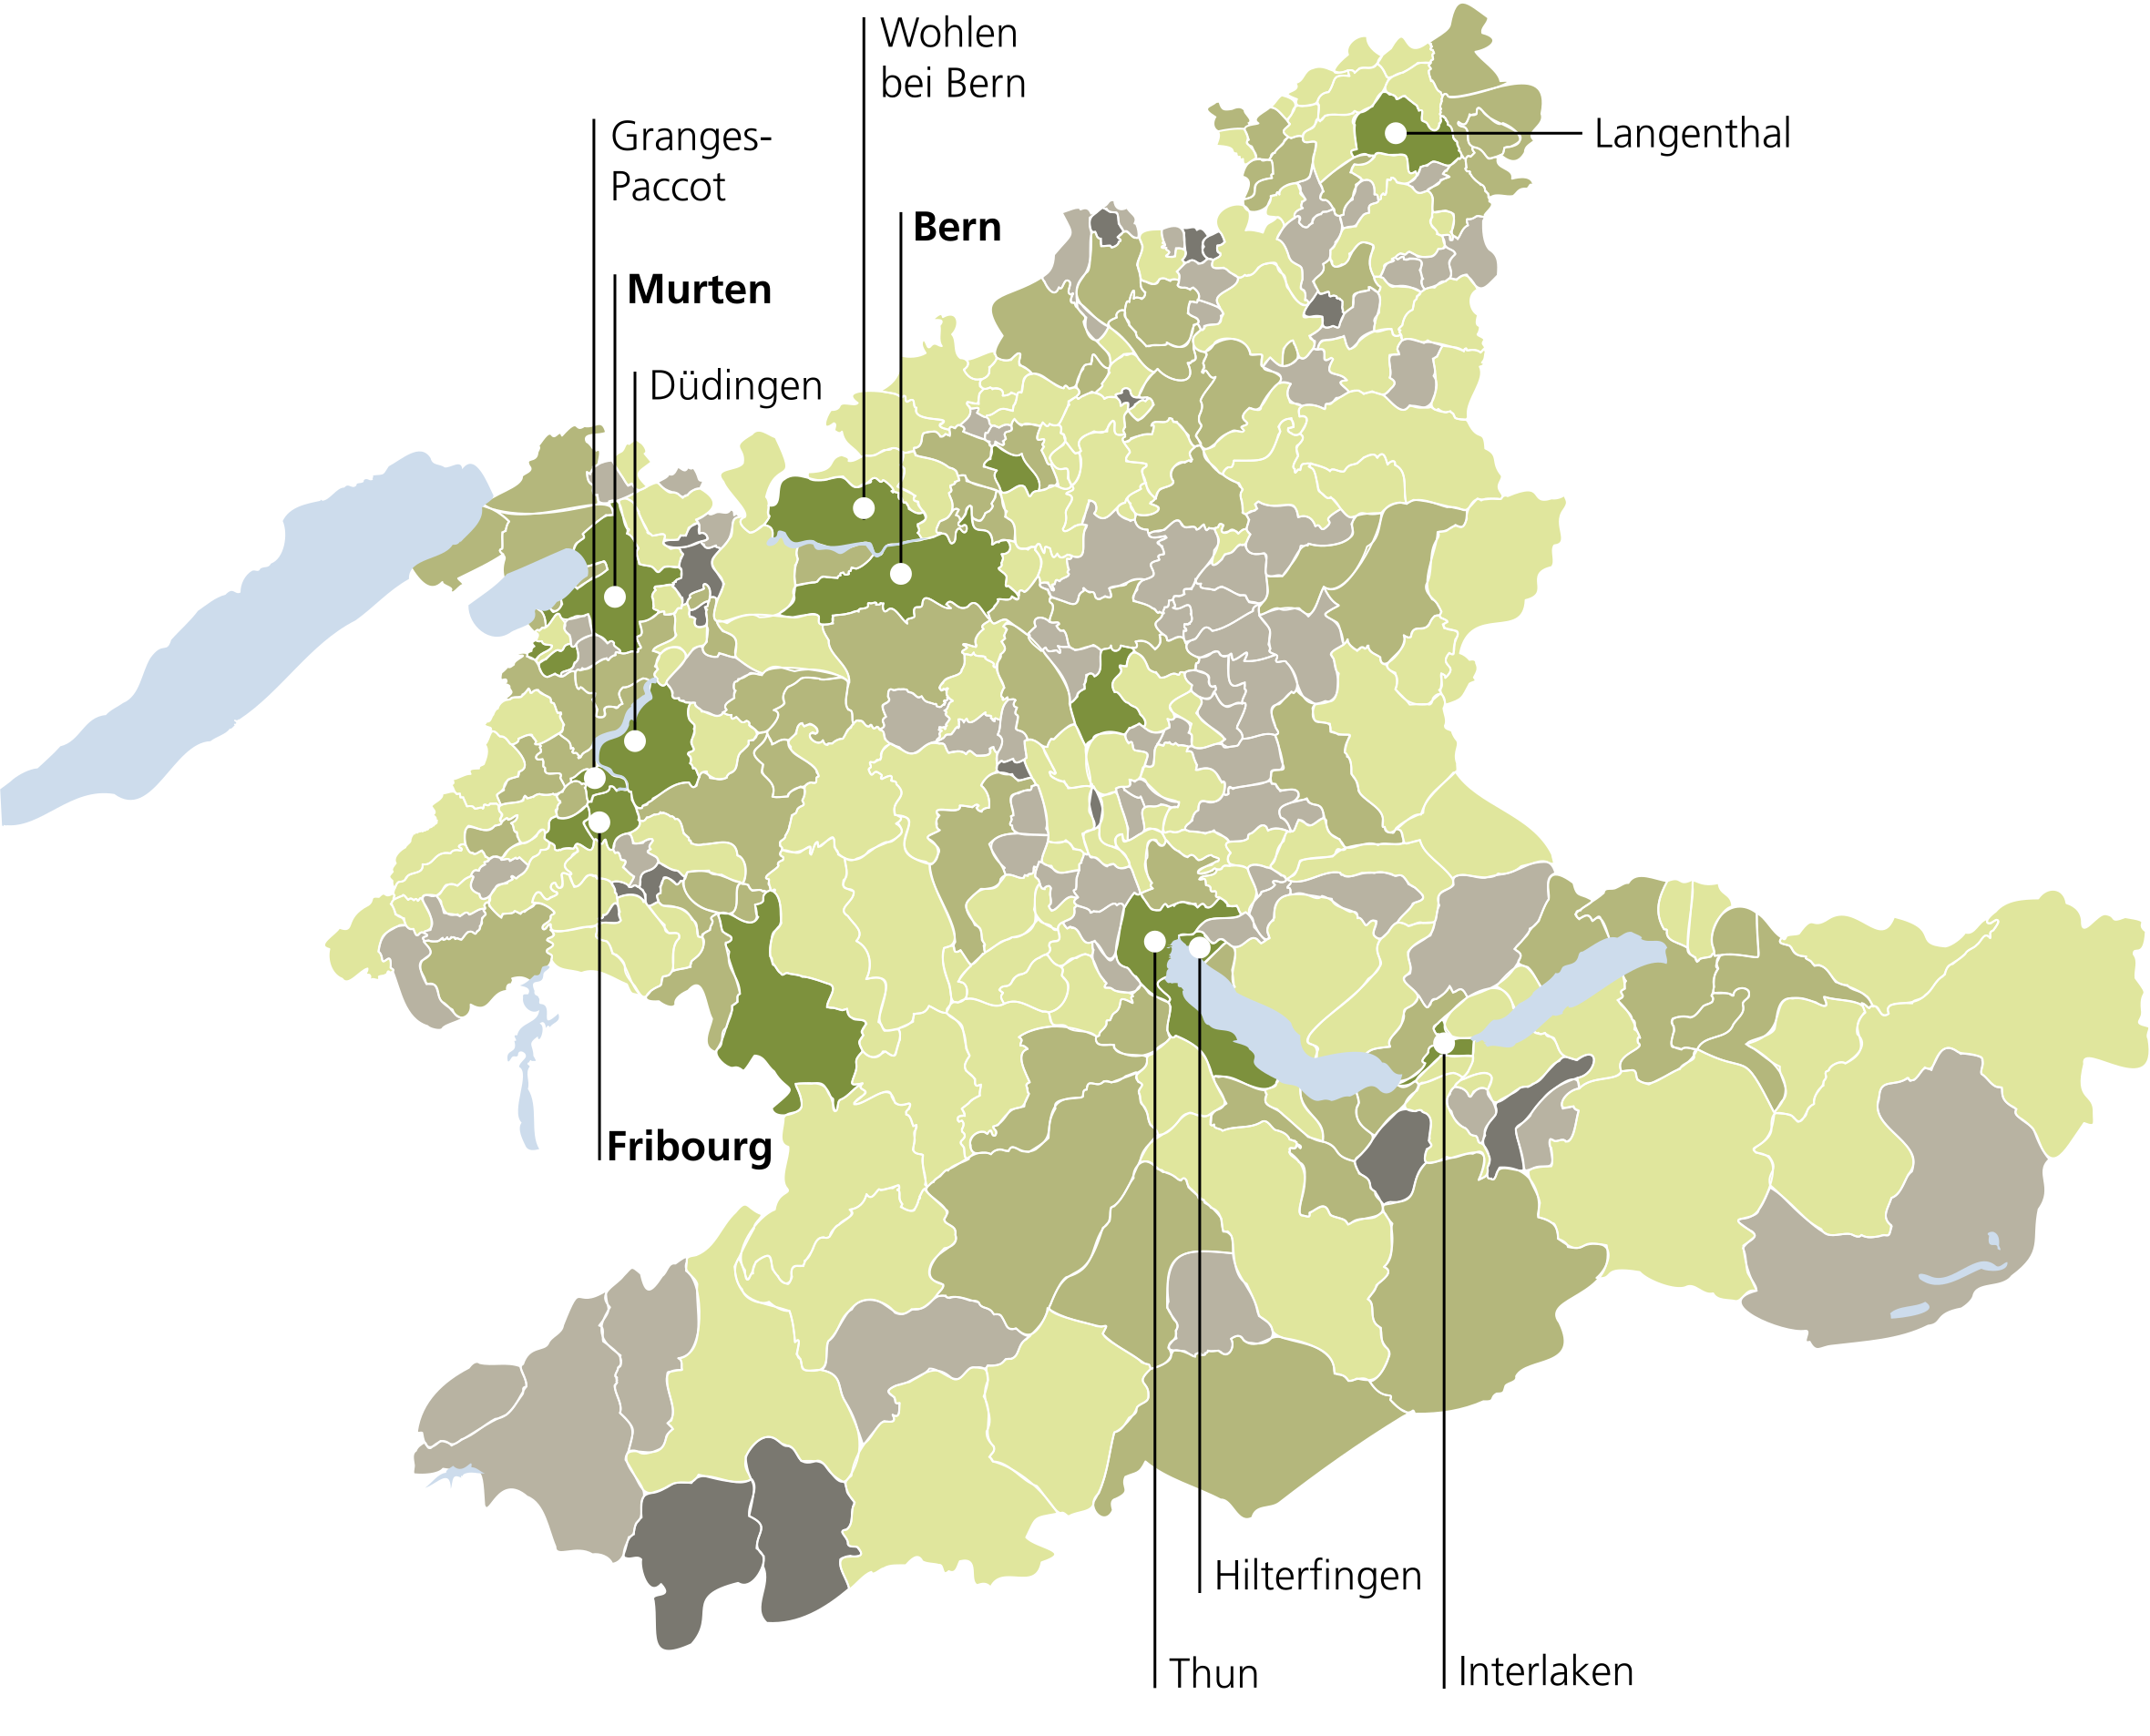

| Rank | Middle income | Low income | High income |
|---|---|---|---|
1 | Luzern (LU) | Luzern (LU) | Luzern (LU) |
2 | Zug (ZG)* | Schwyz (SZ) | Zug (ZG) |
3 | Schwyz (SZ) | Sursee (LU) | Schwyz (SZ) |
4 | Risch (ZG) | Zug (ZG)* | Risch (ZG) |
5 | Baar (ZG) | Arth (SZ) | Baar (ZG) |
6 | Arth (SZ) | Flüelen (UR) | Hergiswil (NW) |
7 | Sursee (LU) | Einsiedeln (SZ) | Hünenberg (ZG) |
8 | Cham (ZG) | Stans (NW) | Cham (ZG) |
9 | Einsiedeln (SZ) | Altdorf (UR) | Walchwil (ZG) |
10 | Hünenberg (ZG) | Ebikon (LU) | Einsiedeln (SZ) |
How well do the individual municipalities within their region fare? The map highlights the differences: Municipalities shaded in dark green are among the most attractive places to live for a tenant household when compared regionally. Municipalities shaded in gray, on the other hand, have below-average attractiveness when compared regionally.
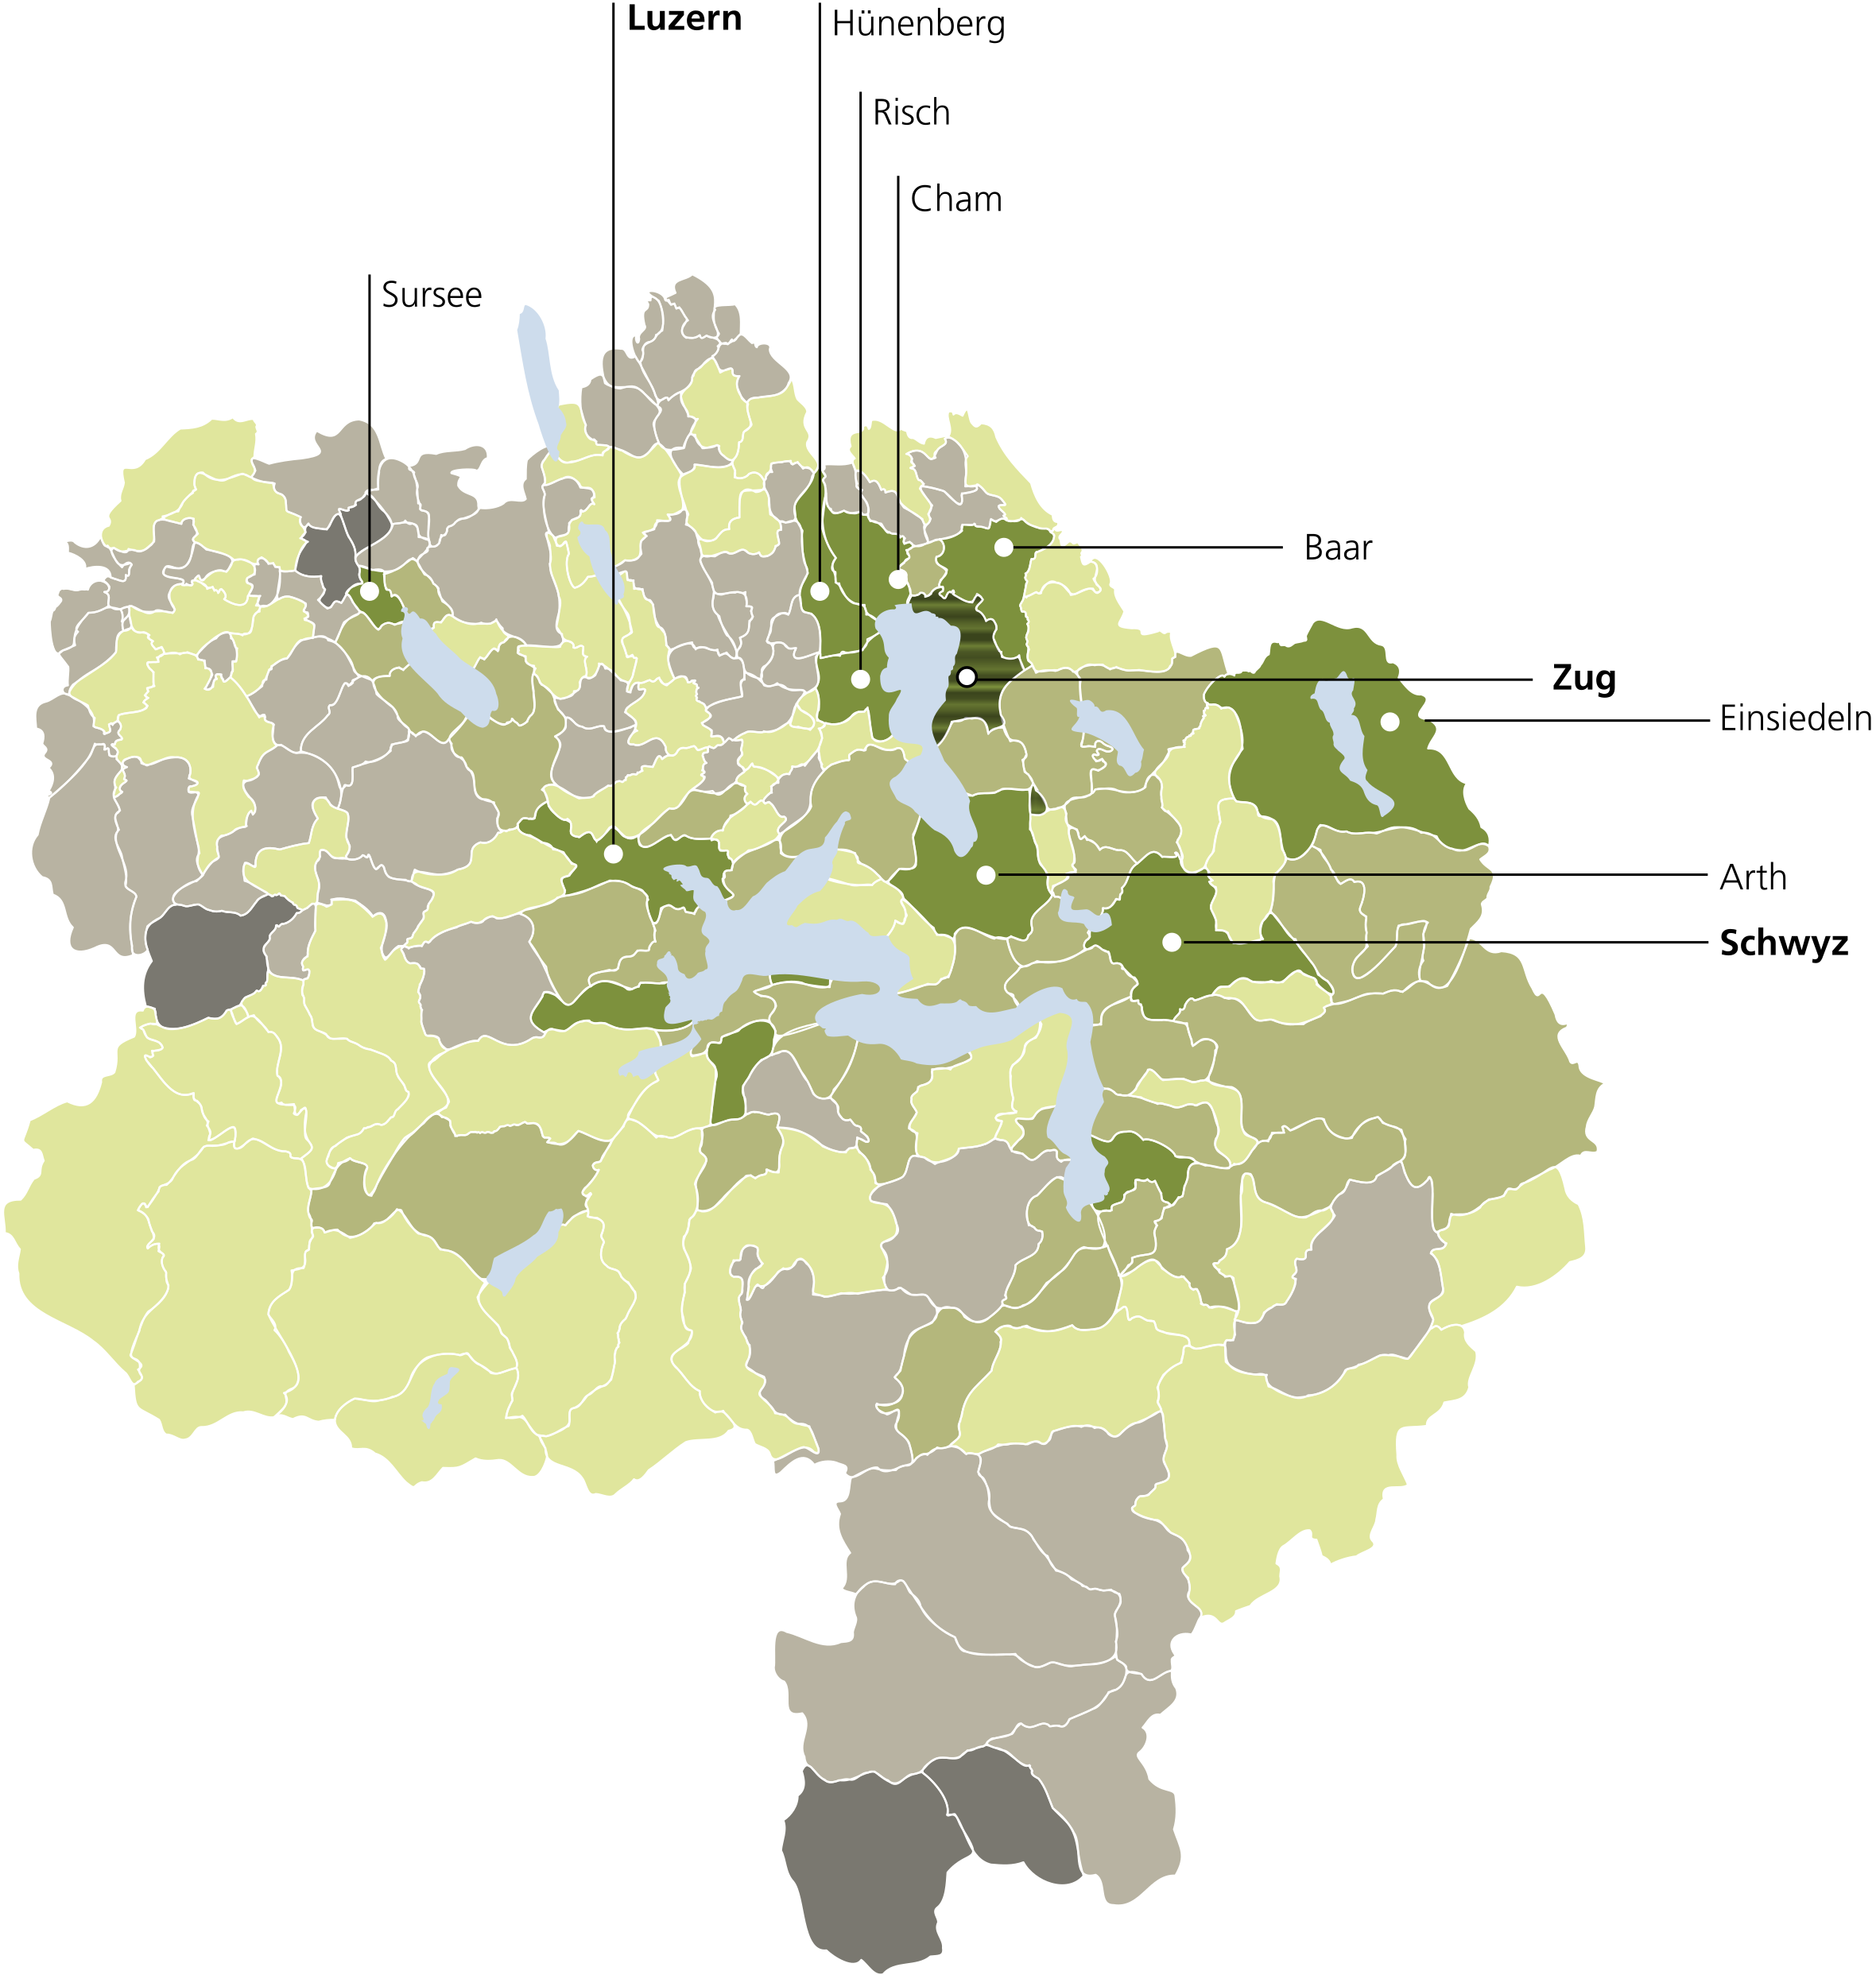

*Note: Zug ranks in the top ten for residential attractiveness for average households; however, an average rental apartment is not affordable. This also applies to Zug for low-income households.
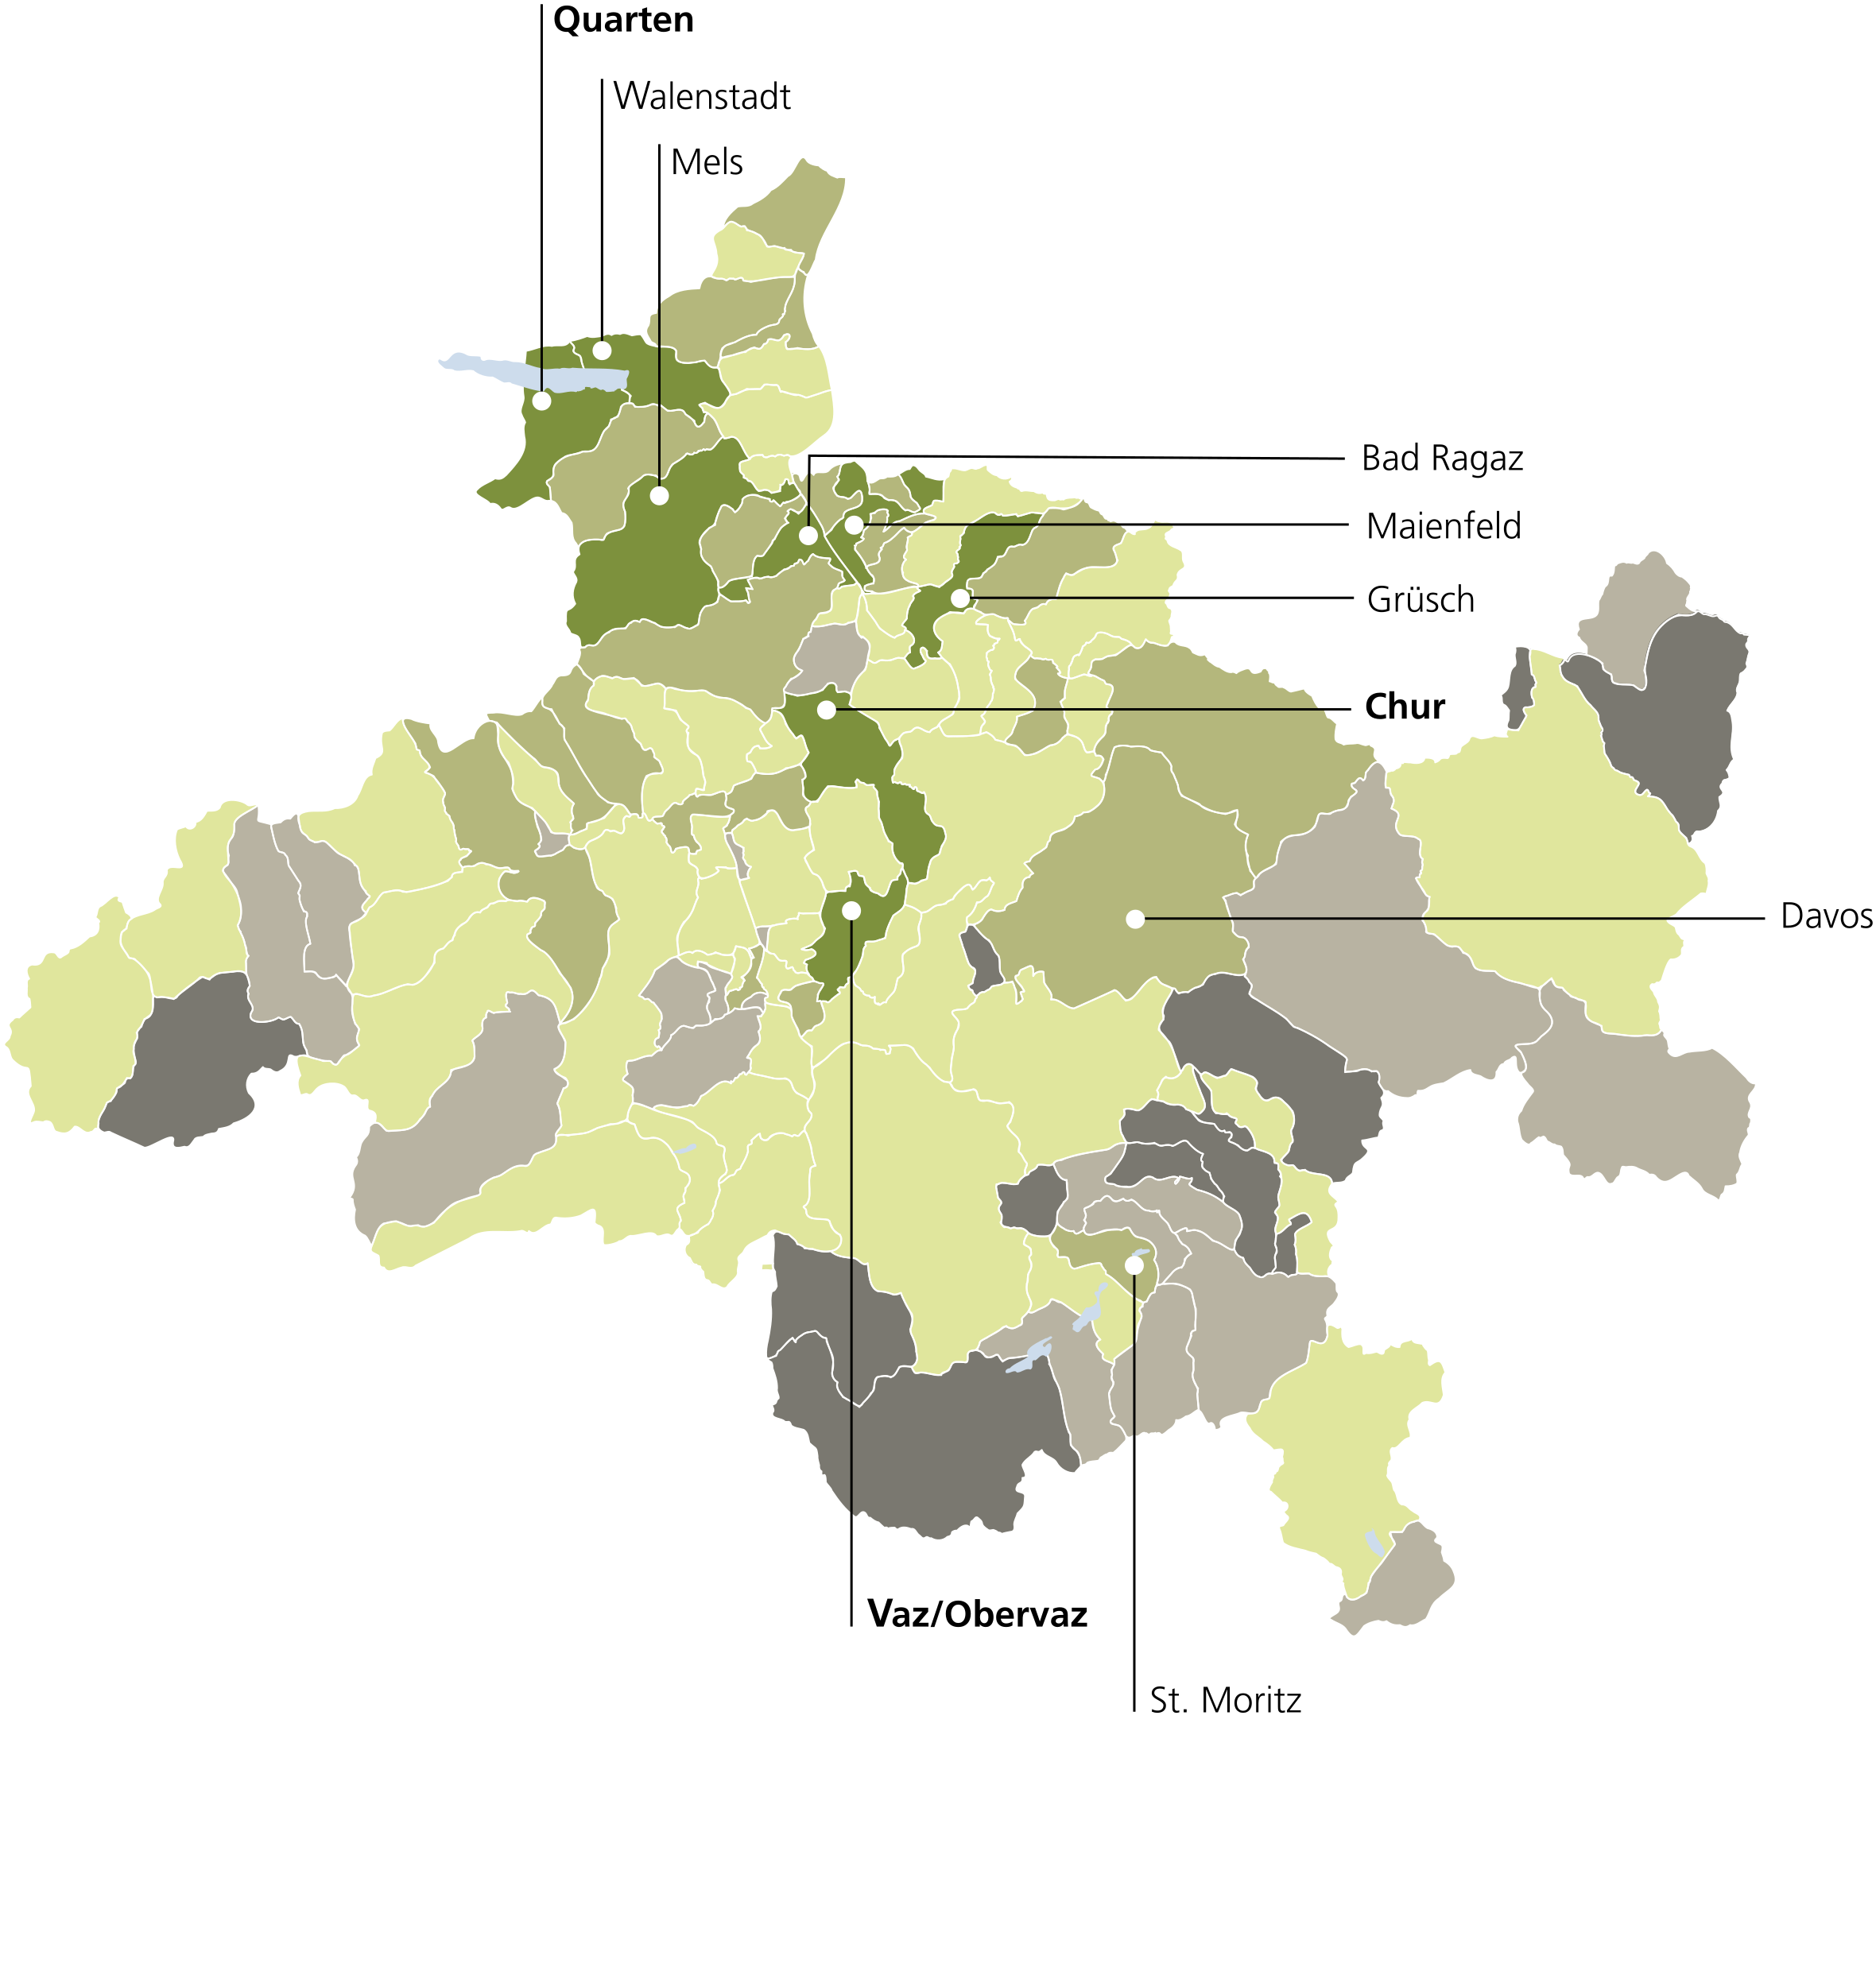
| Rank | Middle income | Low income | High income |
|---|---|---|---|
1 | Chur (GR) | Chur (GR) | Chur (GR) |
2 | Quarten (SG) | Quarten (SG) | Quarten (SG) |
3 | Vaz/Obervaz (GR) | Walenstadt (SG) | Vaz/Obervaz (GR) |
4 | Walenstadt (SG) | Mels (SG) | St. Moritz (GR) |
5 | Mels (SG) | Grüsch (GR) | Laax (GR) |
6 | Bad Ragaz (SG) | Bad Ragaz (SG) | Fläsch (GR) |
7 | Grüsch (GR) | Schiers (GR) | Davos (GR) |
8 | Maienfeld (GR) | Maienfeld (GR) | Maienfeld (GR) |
9 | St. Moritz (GR) | Vaz/Obervaz (GR) | Walenstadt (SG) |
10 | Davos (GR) | Thusis (GR) | Grüsch (GR) |
How well do the individual municipalities within their region fare? The map highlights the differences: Municipalities shaded in dark green are among the most attractive places to live for a tenant household when compared regionally. Municipalities shaded in gray, on the other hand, have below-average attractiveness when compared regionally.

| Rank | Middle income | Low income | High income |
|---|---|---|---|
1 | Vevey (VD) | Vevey (VD) | Vevey (VD) |
2 | Lausanne (VD) | Lausanne (VD)* | Lausanne (VD) |
3 | Morges (VD) | Montreux (VD) | Morges (VD) |
4 | Genève (GE)* | Morges (VD)* | Collonge-Bellerive (GE) |
5 | Montreux (VD) | La Roche (FR) | Genève (GE) |
6 | Pully (VD) | Yverdon-les-Bains (VD) | Pully (VD) |
7 | Collonge-Bellerive (GE) | Noville (VD) | Nyon (VD) |
8 | Nyon (VD) | Monthey (VS) | Lutry (VD) |
9 | La Roche (FR) | Saint-Maurice (VS) | Montreux (VD) |
10 | Noville (VD) | Nyon (VD)* | Cologny (GE) |
How well do the individual municipalities within their region fare? The map highlights the differences: Municipalities shaded in dark green are among the most attractive places to live for a tenant household when compared regionally. Municipalities shaded in gray, on the other hand, have below-average attractiveness when compared regionally.
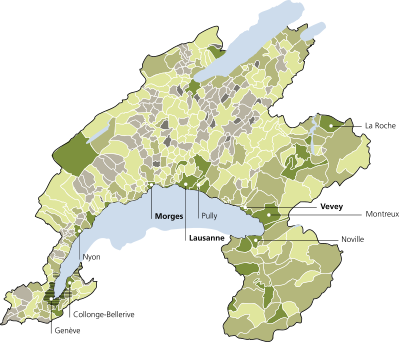

*Note: Geneva ranks in the top ten for residential attractiveness for average households; however, an average rental apartment is not affordable. For low-income households, this applies to the municipalities of Lausanne, Morges and Nyon.
| Rank | Middle income | Low income | High income |
|---|---|---|---|
1 | Solothurn (SO) | Solothurn (SO) | Biel/Bienne (BE) |
2 | Biel/Bienne (BE) | Biel/Bienne (BE) | Solothurn (SO) |
3 | Neuchâtel (NE) | Delémont (JU) | Neuchâtel (NE) |
4 | Laténa (NE) | Nidau (BE) | Feldbrunnen-St. Niklaus (SO) |
5 | Nidau (BE) | Saignelégier (JU) | Laténa (NE) |
6 | Sutz-Lattrigen (BE) | Grenchen (SO) | Buchegg (SO) |
7 | Buchegg (SO) | Buchegg (SO) | Ipsach (BE) |
8 | Delémont (JU) | Neuchâtel (NE) | Erlach (BE) |
9 | Ipsach (BE) | Laténa (NE) | Twann-Tüscherz (BE) |
10 | Erlach (BE) | La Chaux-de-Fonds (NE) | Lüscherz (BE) |
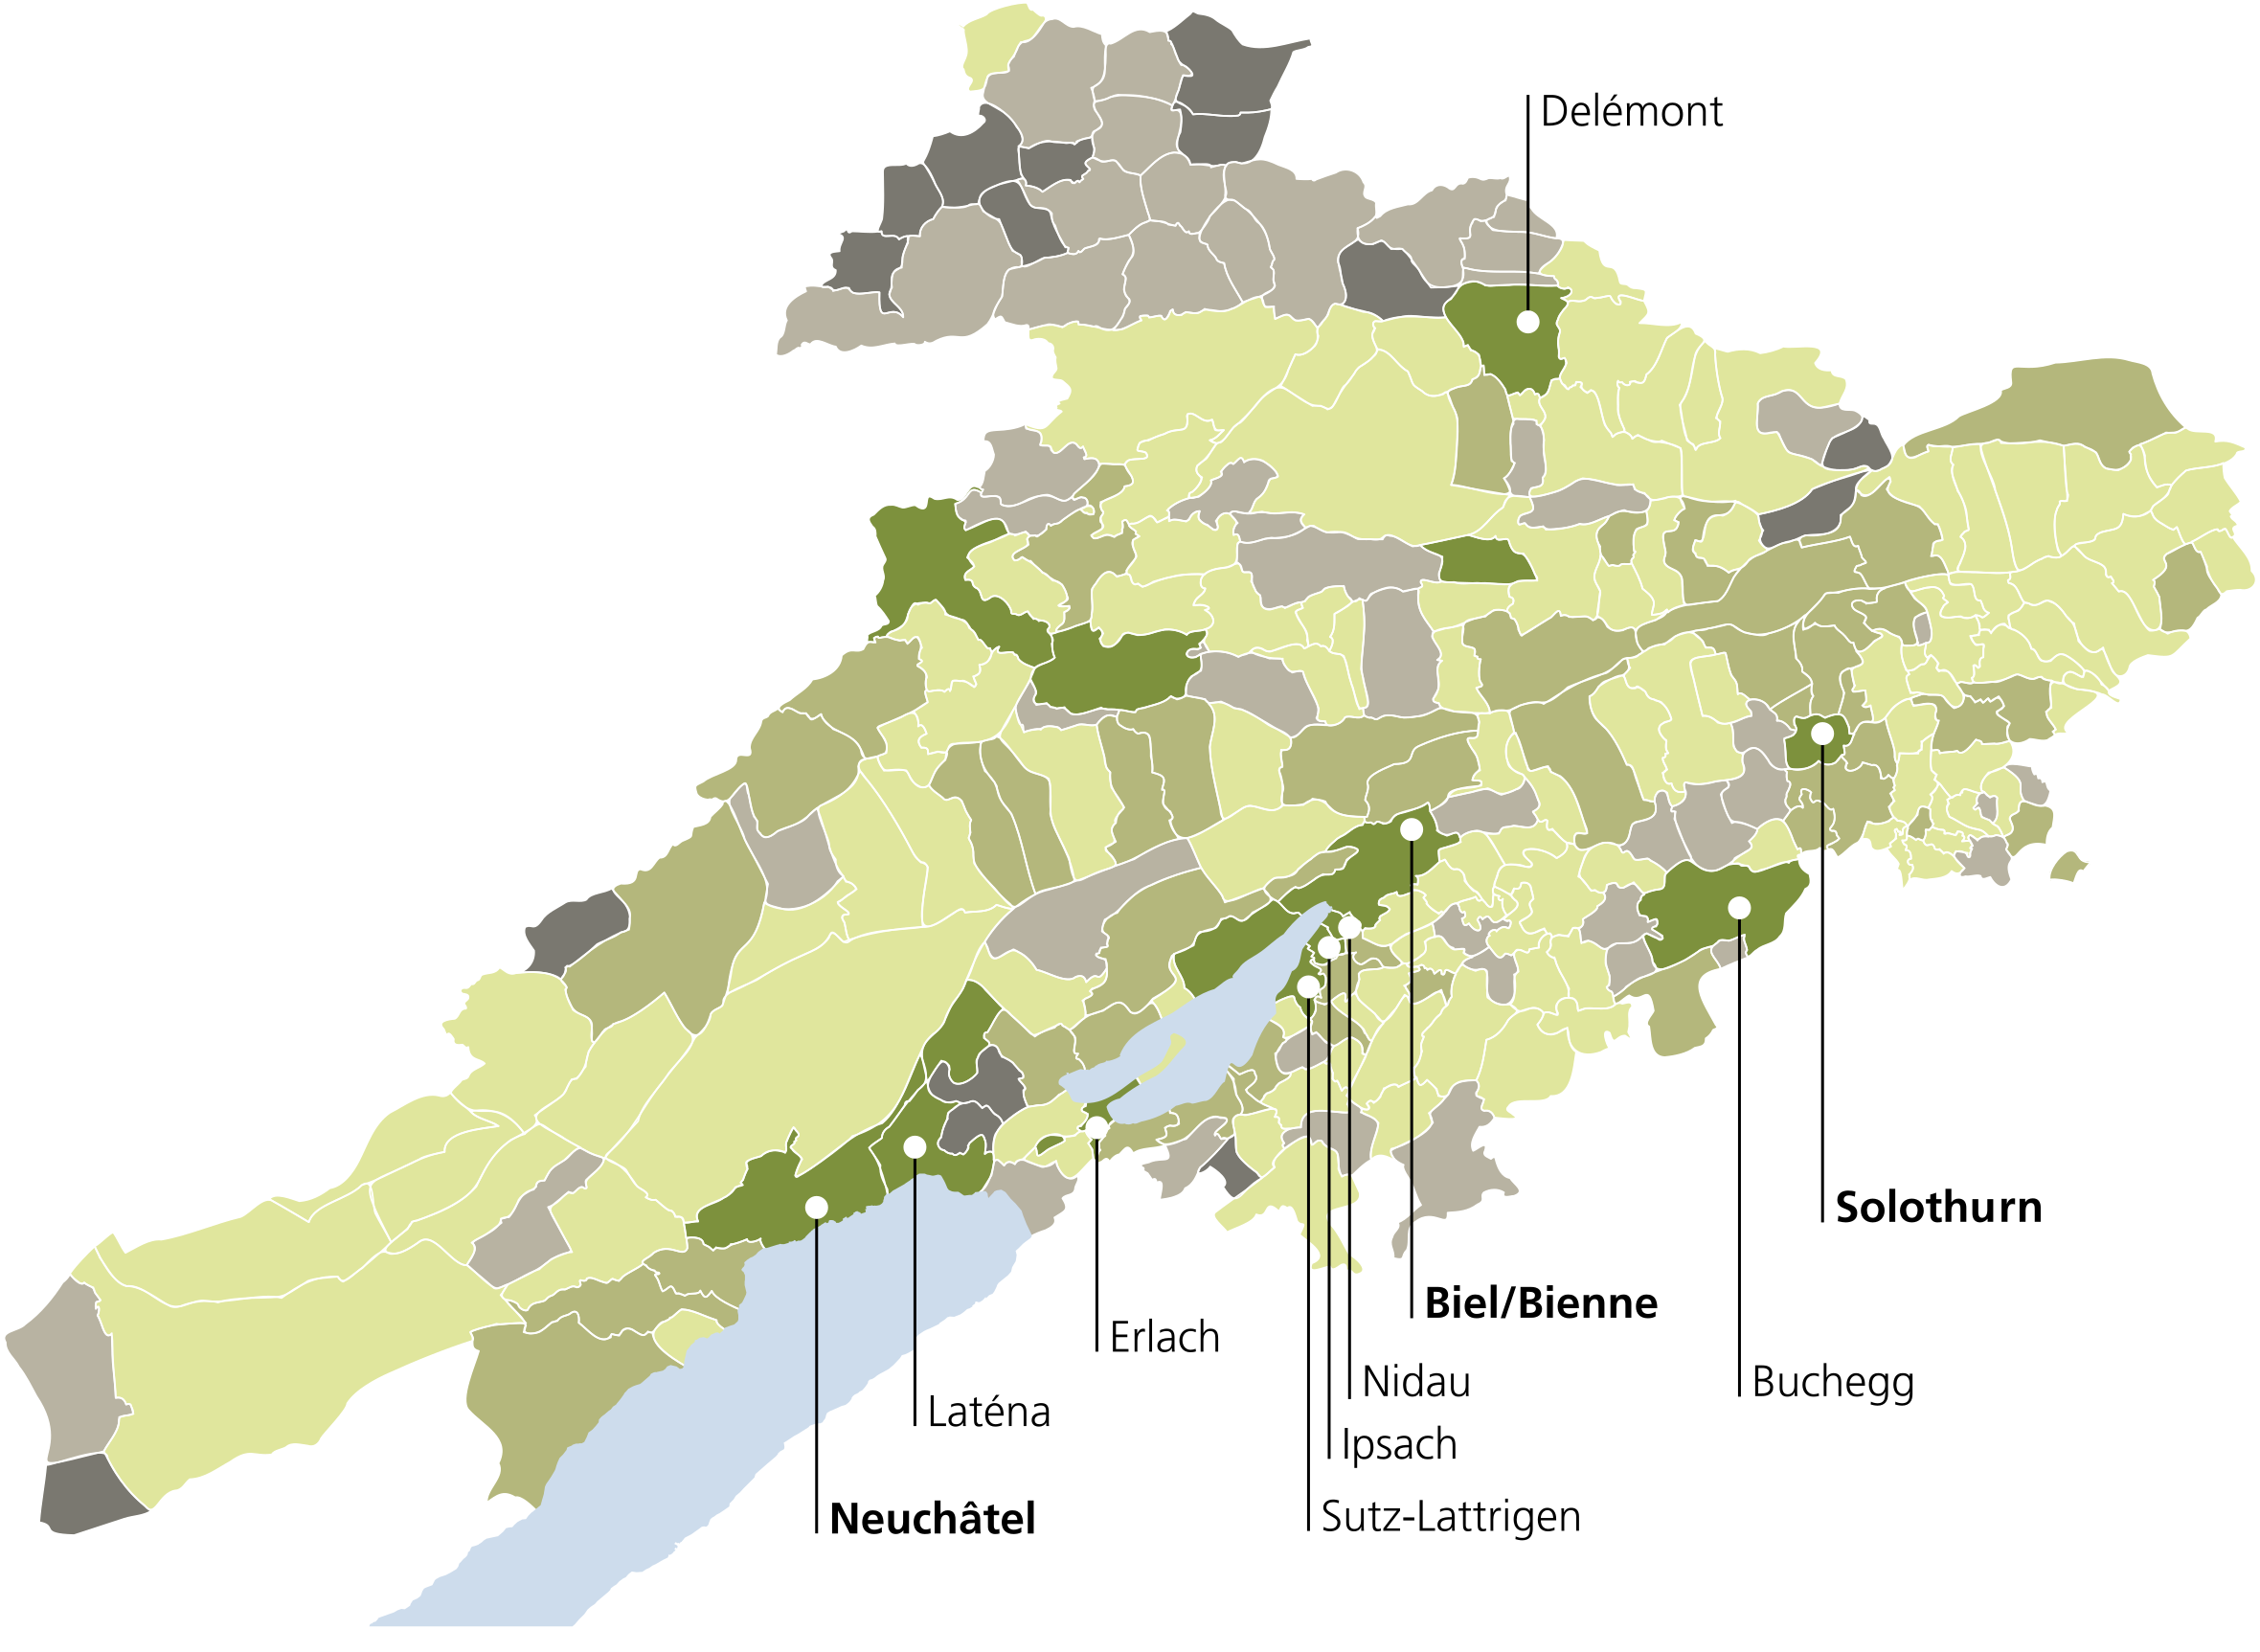
How well do the individual municipalities within their region fare? The map highlights the differences: Municipalities shaded in dark green are among the most attractive places to live for a tenant household when compared regionally. Municipalities shaded in gray, on the other hand, have below-average attractiveness when compared regionally.

| Rank | Middle income | Low income | High income |
|---|---|---|---|
1 | St. Gallen (SG) | St. Gallen (SG) | Teufen (AR) |
2 | Wil (SG) | Rorschach (SG) | St. Gallen (SG) |
3 | Teufen (AR) | Wil (SG) | Appenzell (AI) |
4 | Rorschach (SG) | Wattwil (SG) | Bottighofen (TG) |
5 | Kreuzlingen (TG) | Gossau (SG) | Balgach (SG) |
6 | Gaiserwald (SG) | Romanshorn (TG) | Gaiserwald (SG) |
7 | Appenzell (AI) | Lichtensteig (SG) | Kreuzlingen (TG) |
8 | Gossau (SG) | Neckertal (SG) | Zuzwil (SG) |
9 | Rorschacherberg (SG) | Goldach (SG) | Schwende-Rüte (AI) |
10 | Goldach (SG) | Herisau (AR) | Frauenfeld (TG) |
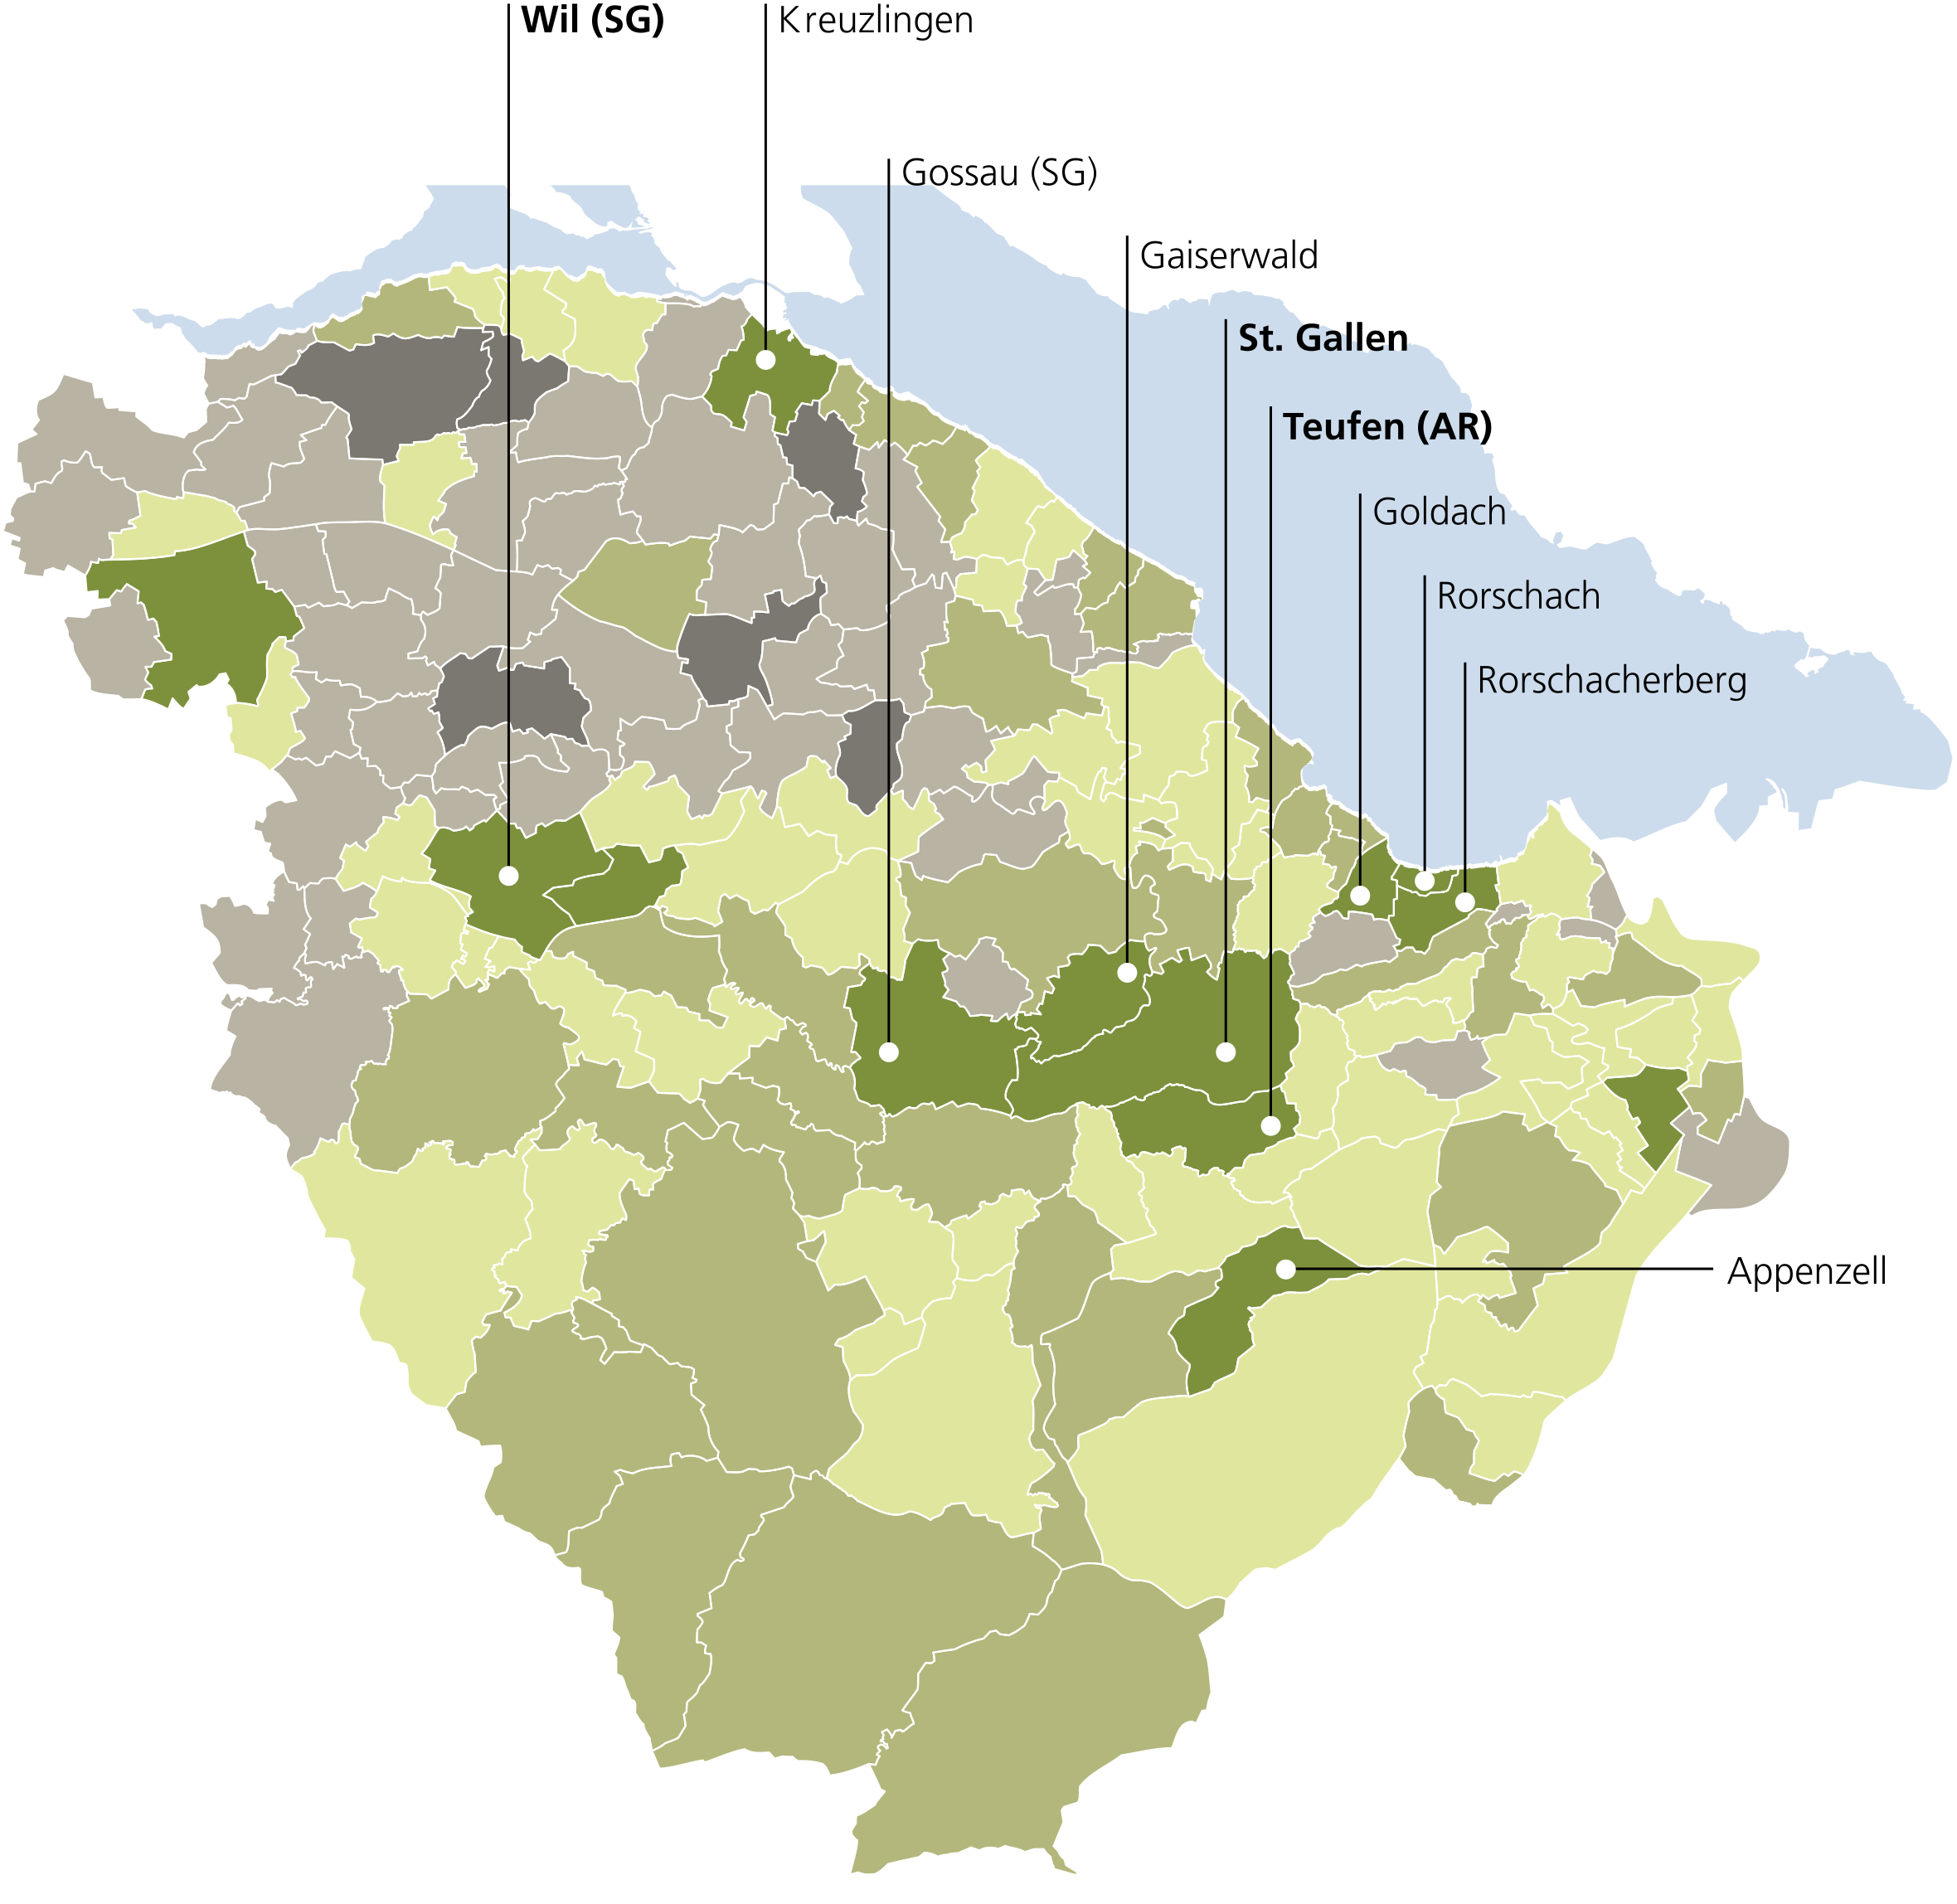
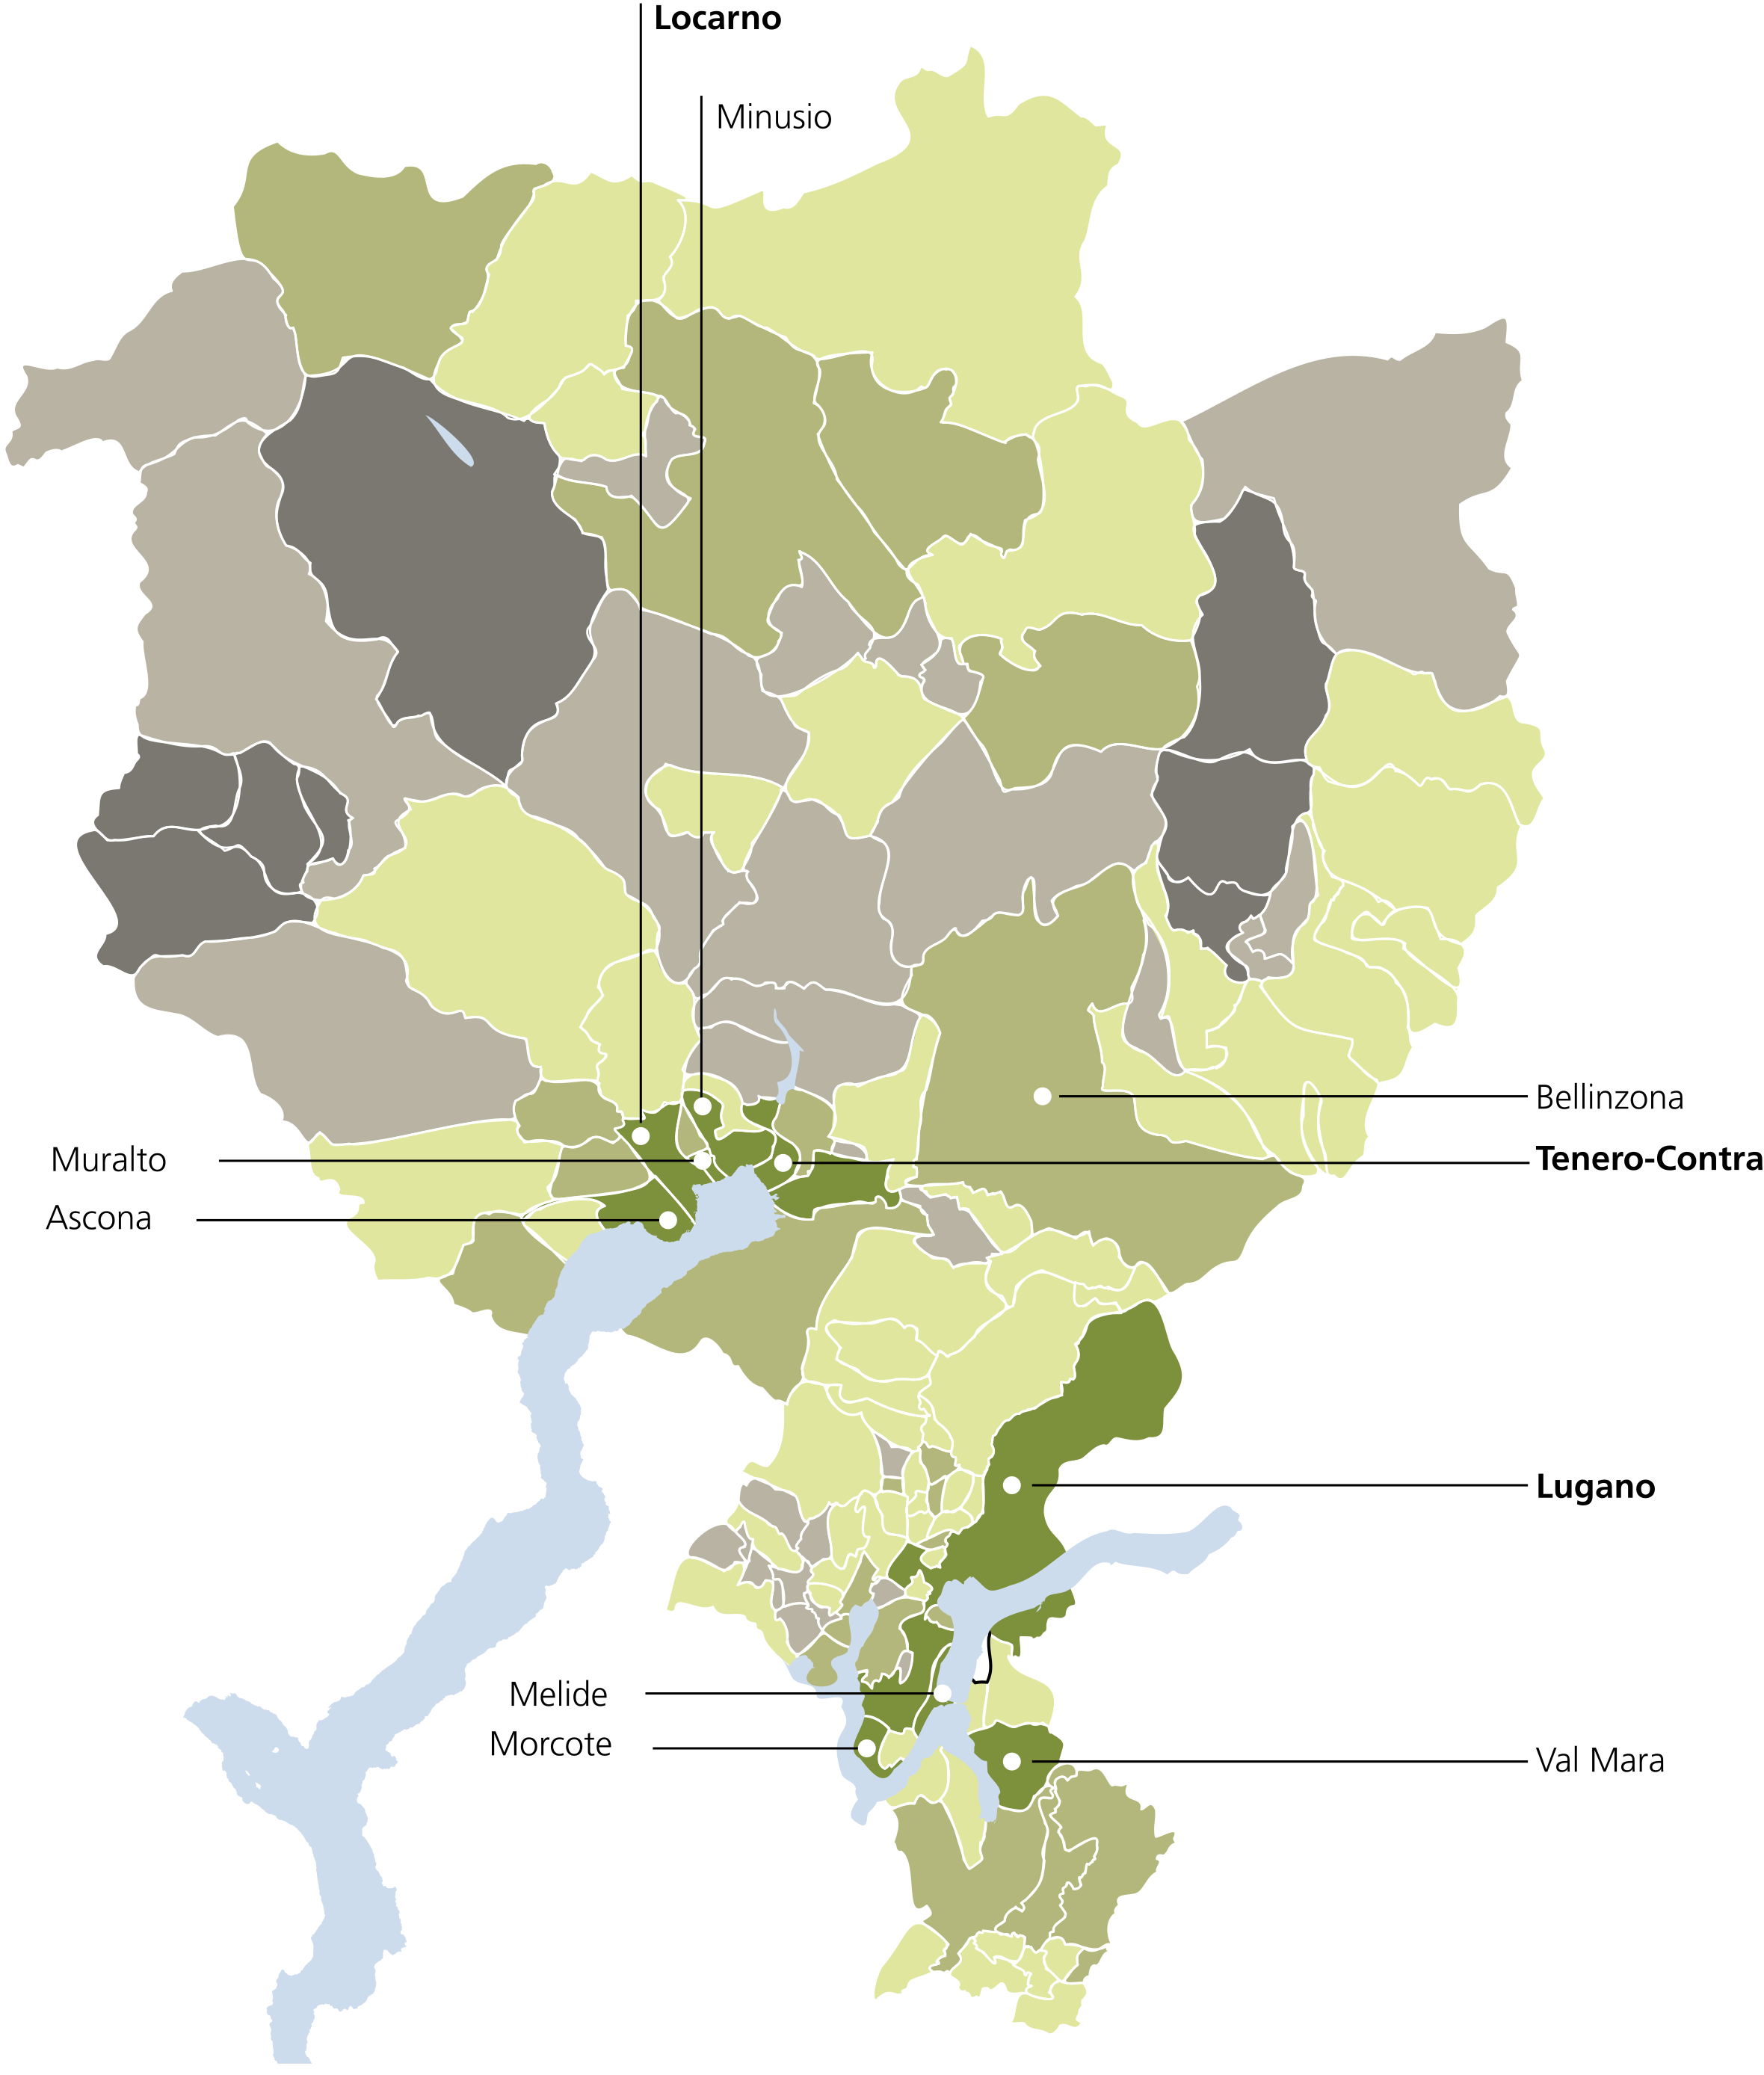
How well do the individual municipalities within their region fare? The map highlights the differences: Municipalities shaded in dark green are among the most attractive places to live for a tenant household when compared regionally. Municipalities shaded in gray, on the other hand, have below-average attractiveness when compared regionally.

| Rank | Middle income | Low income | High income |
|---|---|---|---|
1 | Lugano (TI) | Locarno (TI) | Lugano (TI) |
2 | Locarno (TI) | Tenero-Contra (TI) | Ascona (TI) |
3 | Tenero-Contra (TI) | Lugano (TI) | Locarno (TI) |
4 | Ascona (TI) | Val Mara (TI) | Tenero-Contra (TI) |
5 | Muralto (TI) | Ascona (TI) | Muralto (TI) |
6 | Val Mara (TI) | Muralto (TI) | Melide (TI) |
7 | Minusio (TI) | Bellinzona (TI) | Morcote (TI) |
8 | Melide (TI) | Minusio (TI) | Paradiso (TI) |
9 | Morcote (TI) | Vacallo (TI) | Castel San Pietro (TI) |
10 | Bellinzona (TI) | Mendrisio (TI) | Minusio (TI) |
How well do the individual municipalities within their region fare? The map highlights the differences: Municipalities shaded in dark green are among the most attractive places to live for a tenant household when compared regionally. Municipalities shaded in gray, on the other hand, have below-average attractiveness when compared regionally.

| Rank | Middle income | Low income | High income |
|---|---|---|---|
1 | Sion (VS) | Sion (VS) | Sion (VS) |
2 | Martigny (VS) | Anniviers (VS) | Val de Bagnes (VS) |
3 | Conthey (VS) | Salvan (VS) | Conthey (VS) |
4 | Salvan (VS) | Martigny (VS) | Crans-Montana (VS) |
5 | Val de Bagnes (VS) | Martigny-Combe (VS) | Martigny (VS) |
6 | Anniviers (VS) | Sierre (VS) | Brig-Glis (VS) |
7 | Nendaz (VS) | Conthey (VS) | Nendaz (VS) |
8 | Sierre (VS) | Vex (VS) | Salvan (VS) |
9 | Mont-Noble (VS) | Mont-Noble (VS) | Savièse (VS) |
10 | Martigny-Combe (VS) | Orsières (VS) | Martigny-Combe (VS) |
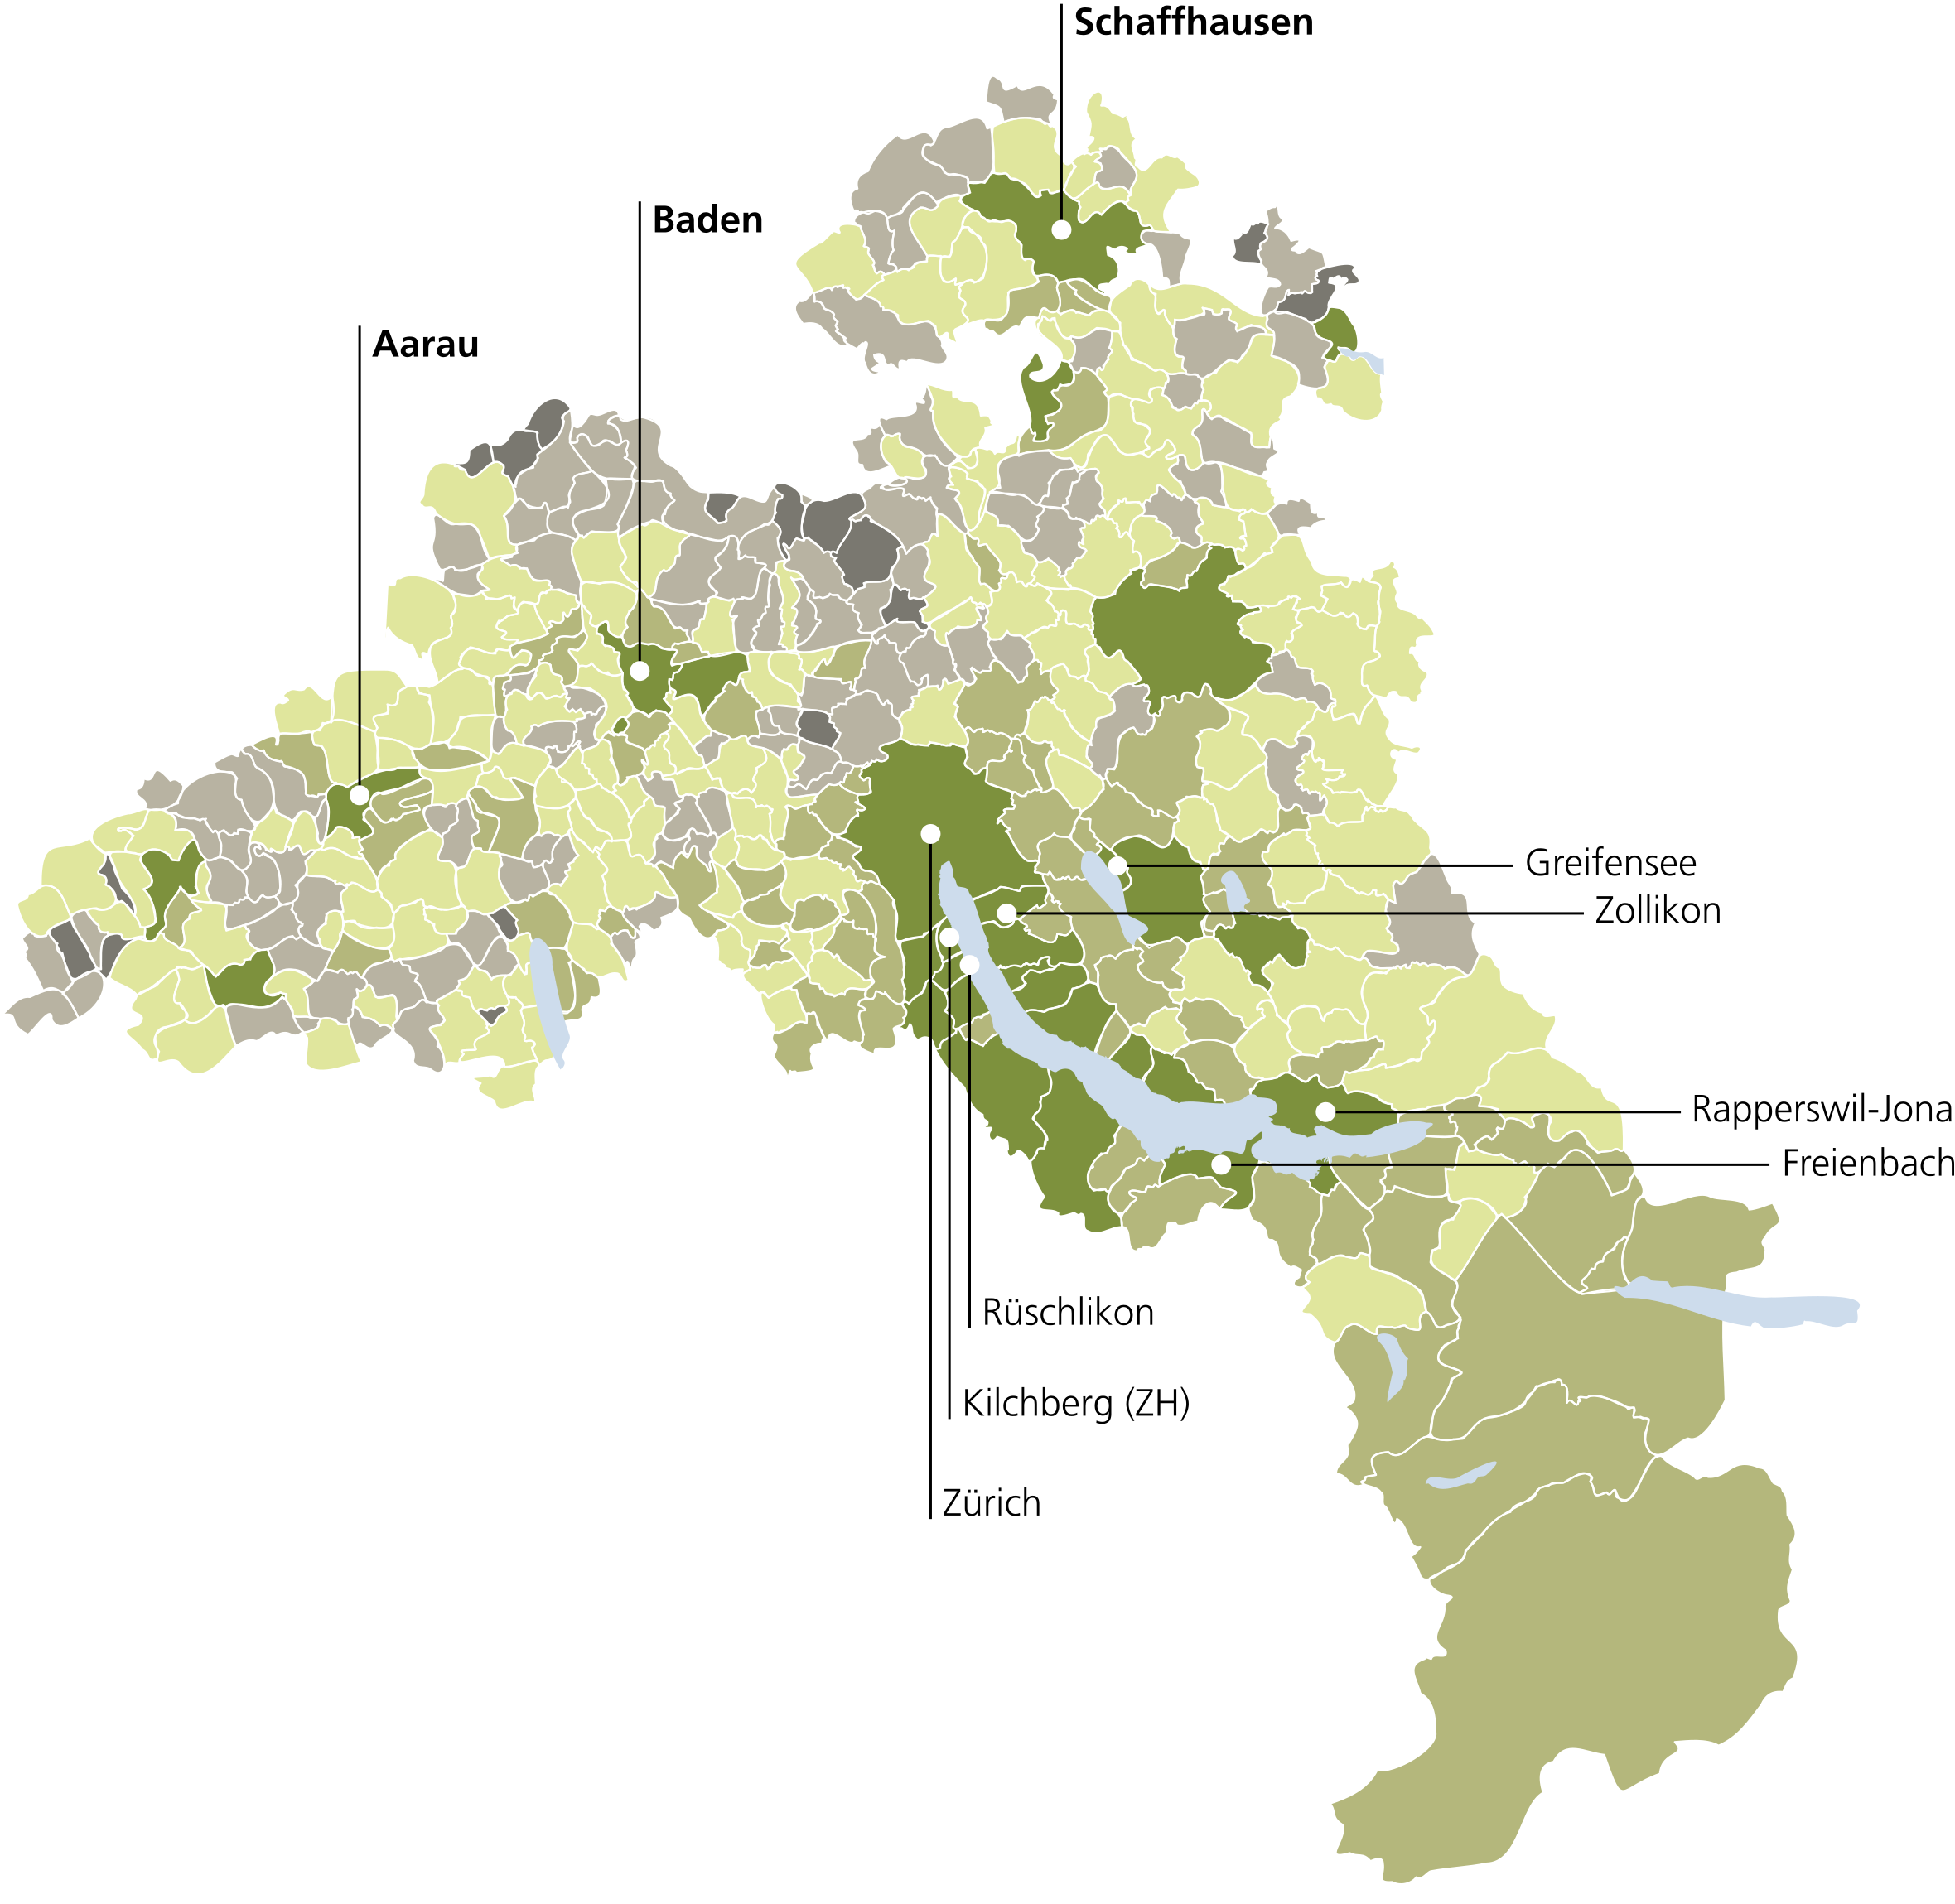
How well do the individual municipalities within their region fare? The map highlights the differences: Municipalities shaded in dark green are among the most attractive places to live for a tenant household when compared regionally. Municipalities shaded in gray, on the other hand, have below-average attractiveness when compared regionally.
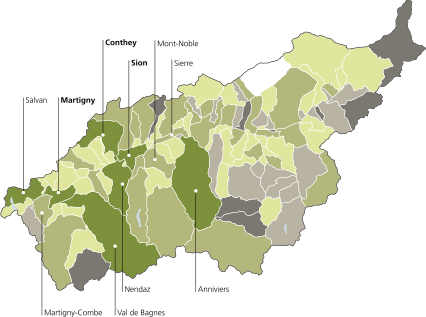
Note: No value is reported for the municipality of Blatten.

| Rank | Middle income | Low income | High income |
|---|---|---|---|
1 | Aarau (AG) | Aarau (AG) | Freienbach (SZ) |
2 | Baden (AG) | Schaffhausen (SH) | Lachen (SZ) |
3 | Schaffhausen (SH) | Baden (AG) | Rapperswil-Jona (SG) |
4 | Zürich (ZH) | Olten (SO) | Zürich (ZH) |
5 | Rapperswil-Jona (SG) | Zofingen (AG) | Rüschlikon (ZH) |
6 | Zollikon (ZH) | Stein am Rhein (SH) | Zollikon (ZH) |
7 | Rüschlikon (ZH) | Rapperswil-Jona (SG) | Kilchberg (ZH) |
8 | Greifensee (ZH) | Uster (ZH) | Baden (AG) |
9 | Kilchberg (ZH) | Greifensee (ZH) | Aarau (AG) |
10 | Freienbach (SZ) | Winterthur (ZH) | Küsnacht (ZH) |
How well do the individual municipalities within their region fare? The map highlights the differences: Municipalities shaded in dark green are among the most attractive places to live for a tenant household when compared regionally. Municipalities shaded in gray, on the other hand, have below-average attractiveness when compared regionally.

While the Residential Attractiveness Indicator 2026 confirms a number of well-known places as being attractive to live in, it also reveals some new favorites: Municipalities such as Laténa (NE), Buchegg (SO), Erlach (BE) and Hünenberg (ZG) are among the top ten in their region. The diverse findings at the top show that a location’s appeal as a place to live can be based on a variety of strengths, and that the interplay of various location factors is crucial. In this way, even smaller and previously overlooked municipalities are making their way to the top of the regional rankings.
At the same time, the study makes it clear that there is no single ideal place to live. Which municipality is particularly attractive ultimately depends on the needs and financial circumstances of the respective household.


municipalities
regions
criteria
income groups
The UBS Residential Attractiveness Indicator (RAI) measures how attractive municipalities are in Switzerland as places to live. The focus is on families with two children. In this process, more than 2,000 municipalities are evaluated based on 38 objective and measurable criteria.
The RAI is not a Swiss-wide ranking, but instead compares municipalities within 10 regions. These are based on the labor market regions defined by the Federal Statistical Office (FSO) and represent functional living and commuting areas. This is because about 70% of all moves in Switzerland take place within a radius of less than 10 kilometers. Through regional comparisons, the Residential Attractiveness Indicator takes this mobility behavior into account.
The analysis is based on three pillars:

Factors taken into account include the accessibility of large, medium-sized and small urban centers via public and private transport, proximity to jobs, the availability of educational and health care services as well as shopping possibilities.
Variables for infrastructure and accessibility

This pillar encompasses the availability and density of leisure and sports facilities, as well as criteria such as the availability of green spaces, aircraft noise or crime rates.
Variables for leisure and quality of life

The "Costs" pillar includes listed rents, tax expenditure, and median health insurance premiums.
Variables for costs
The Residential Attractiveness Indicator is not a beauty contest. Instead, residential attractiveness is measured using 38 variables, ensuring that only objectively quantifiable factors are included in the analysis.

When choosing the right place to live, it is rarely possible to balance the key factors – infrastructure, leisure opportunities, accessibility, and cost of living – without making compromises.
The study provides a comprehensive guide, focusing on families with two children who rent their homes.
Arrange an appointment for a non-binding consultation or if you have any questions, just give us a call.
Disclaimer
Diese Publikation dient nur zur persönlichen Information innerhalb der Schweiz und ist nicht als Empfehlung, Offerte oder Aufforderung zur Offertstellung für Anlage- oder andere spezifische Produkte und Dienstleistungen zu verstehen. Sie stellt keine Anlage-, Rechts- oder Steuerberatung dar und sollte nicht als Grundlage für finanzielle Entscheide dienen. Sie sollten sich professionell beraten lassen, bevor Sie eine diesbezügliche Entscheidung treffen.
Alle in dieser Publikation enthaltenen Informationen und Meinungen stammen aus als zuverlässig und glaubwürdig eingestuften Quellen, trotzdem lehnt UBS jede vertragliche oder stillschweigende Haftung für falsche oder unvollständige Informationen ab. Die Ansichten von UBS-externen Autorinnen und Autoren sind deren eigene Meinung und spiegeln nicht zwingend die Auffassung von UBS AG und ihren verbundenen Unternehmen wider. Die vollständige oder teilweise Reproduktion ohne ausdrückliche Erlaubnis von UBS ist untersagt.
© UBS 1998 - 2026. Alle Rechte vorbehalten. Das Schlüsselsymbol und UBS gehören zu den geschützten Marken von UBS.