Credit investing in a higher interest rate world
A four-point framework for credit investing in a higher yield environment and why European High Yield could offer value.
How can credit investors weather the looming stagflationary storm?
How can credit investors weather the looming stagflationary storm?
Fixed income investors have a lot to consider right now. European government bond yields have catapulted into positive territory, inflation is the highest it has been in 40 years. The largest war in Europe since WWII rages on and the prospect of slower growth looms large (Charts 1&2). All of this has un-anchored government and central bank policies and created enormous ambiguity in the near-term outlook.
With this in mind, we provide a framework of how to think about high yield and credit investing in a higher government bond yield environment and why we think European high yield (EHY) could offer value relative to comparable asset classes.
Chart 1: Current level of European and US inflation
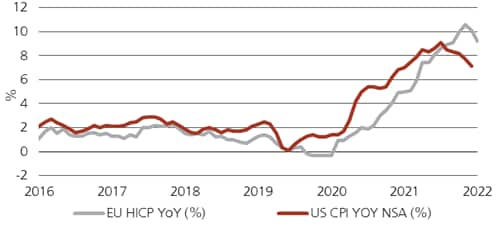
Chart 2: Global government bond yields in developed markets
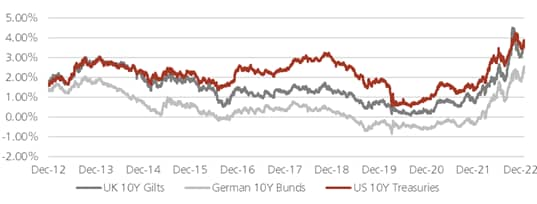
Inflationary forces have upended risk premiums and by extension, prospective asset class returns in fixed income. As we start 2023 there are signs peak inflation could be behind us despite being at extremely elevated levels. As a result, the ability to forecast when inflation will reach central banks’ targets – such as the 2% European Central Bank (ECB) target is a hard task. There are even thoughts that inflation targeting should move higher than the current 2% target number, with the post-COVID labour market being a major factor as to why. But which markets are best positioned to weather the inflationary storm and offer protection against further rising nominal rates?
1) European high yield is a low duration asset class.
This means it has less price volatility to rate rises than longer duration credit classes such as global investment grade. Additionally, we have been positioned even more conservatively in terms of interest rate sensitivity relative to the broader market and higher quality corporates bonds. This view has played out well over the past 12 months, with substantial relative excess returns over German Bunds. This asset class should continue to offer effective protection against rising interest rates as central banks are likely to continue to tighten monetary policy.
Attractiveness of asset class characteristics
Characteristics | Characteristics | European High Yield Index | European High Yield Index | European Investment Grade Index | European Investment Grade Index |
|---|---|---|---|---|---|
Characteristics | Yield to worst | European High Yield Index | 7.3% | European Investment Grade Index | 3.7% |
Characteristics | Modified duration | European High Yield Index | 3.2 years | European Investment Grade Index | 4.7 years |
Characteristics | Spread duration | European High Yield Index | 4.2 years | European Investment Grade Index | 5.1 years |
Characteristics | Average credit rating | European High Yield Index | BB3 | European Investment Grade Index | A3 |
Characteristics | Breakevens (bps) | European High Yield Index | 228 bps | European Investment Grade Index | 78bps |
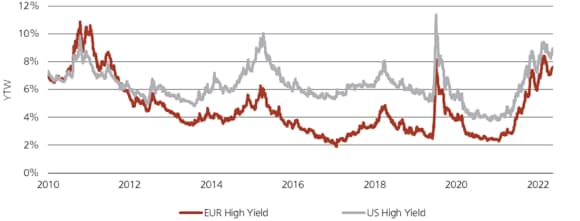
2) European high yield can offer attractive income protection, with yields currently of over 7.0%.
Investors are concerned about: (i) a slowdown in consumer spending and corporate capex leading to recessionary risks possibly impacting the fundamental outlook for corporates; and (ii) the end of ECB and US Fed stimulus packages, which will remove liquidity and money supply from the market, impacting spreads.
Our base case is not for an early 2023 US or Eurozone wide recession, although a combination of low growth and above trend inflation, ‘stagflation’, seems likely. It is also possible countries like Germany and the UK enter a short shallow recession, albeit this is reflected in market pricing.
In either scenario, the European high yield sector should be able to offer high income protection. Based on the table above, the break-even on the asset class is 2.28% which means yields would have to rise 2.28% before European high yield experiences a negative total return on an annual basis. Comparatively, a mere 0.78% rise in yields could tip the European investment grade market into further negative return territory.
Chart 3: Evolution of Euro and US spreads (as measured by main high yield indices)

Chart 4: Evolution of Euro and US yields (as measured by main high yield indices)
3) Low expected default rates support buy and hold investors.
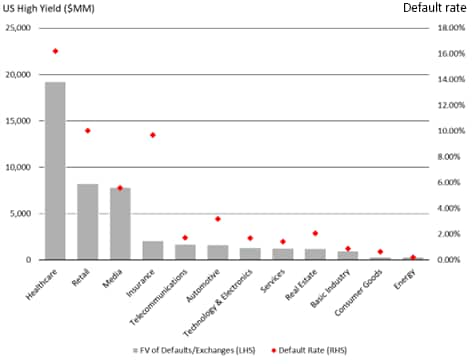
Our latest forecasts for European and US high yield defaults for 2023 show a benign default outlook similar to the long-term averages, with Europe forecast at 3.4%. Many of these defaults are well flagged with the securities already trading at distressed levels and as such and should be rather simple to avoid. In comparison to Moody’s, who expect a lower default rate, our analysts are more conservative in their forecasts, helping us take careful steps when performing security selection.
As mentioned, Moody’s expects the default rate to climb on a 12 month forward looking basis from the lows of 2022, but state in a recent note that “the projected increase will be modest, and the default rate will remain below the long-term average”. For example, they see the European speculative grade credit default rate reaching approximately 2.2% by H1 2023. With yields at around 7-8% or higher in Europe, this is an attractive entry point for investors even if defaults trend unexpectedly higher.
Chart 5: EUR high yield defaults expected to be up to 3.4% in 2023 (EURm)
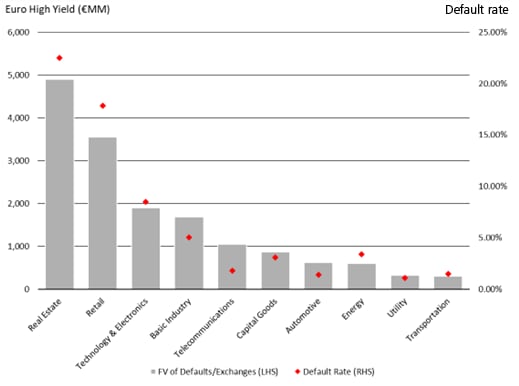
Chart 6: US high yield defaults expected to be up to 3.3% in 2023 (USDm)
4) Active management is key to avoiding credit losses.
In a scenario where default rates rise above the baseline forecast, investors will want to minimize default and credit losses. For example, if certain sectors see an increase in downgrades, such as in the European retail sector, an investor should try to avoid these securities. Alternatively, an investor could implement sound risk management (including but not limited to the use of hedging instruments) thereby protecting on the downside and increasing the ability to outperform passive or indexed funds over time.
To find out more about UBS AM’s fixed income offering, click here.
Make an inquiry
Fill in an inquiry form and leave your details – we’ll be back in touch.
Introducing our leadership team
Meet the members of the team responsible for UBS Asset Management’s strategic direction.

