Driving change through dialogue
We share our insights from three years of dialogue with companies
At the end of February, we reached the three-year anniversary which we had set for the program. By the end of February 2021, we assessed the progress made by the companies in the focus list against tailored engagement objectives.
Our assessments have been conducted using the following methodology:
Our assessments have been conducted using the following methodology:
- 45 companies have been assessed in total (there have been several mergers and acquisition in our original list and two companies were added later on during the program).
- We assigned tailored engagement objectives for each company in the list when we first met management and prepared our initial research. As previously mentioned, these objectives have followed the Taskforce on Climate-related Financial Disclosure (TCFD) framework.
- We have made notes on progress against these objectives over the course of the engagement dialogue.
- We assessed progress made and we divided the companies in different categories depending on percentage-weighted engagement objectives met (see Table 1 and Figure 1).
The final analysis shows that more than 58% of companies in our focus list have made good or excellent progress against set objectives. However, there is still a percentage of companies with limited or partial action on addressing the climate change challenge.
Tabel 1: The outcomes of three years of dialogue on climate
Categories | Categories | Weighted engagement objectives met | Weighted engagement objectives met | Number of companies | Number of companies | Percentage | Percentage |
|---|---|---|---|---|---|---|---|
Categories | Excellent | Weighted engagement objectives met | (76-100%) | Number of companies | 8 | Percentage | 18% |
Categories | Good | Weighted engagement objectives met | (51-76%) | Number of companies | 18 | Percentage | 40% |
Categories | Some | Weighted engagement objectives met | (26-50%) | Number of companies | 17 | Percentage | 38% |
Categories | Limited | Weighted engagement objectives met | (0-25%) | Number of companies | 2 | Percentage | 4% |
Categories | Total | Weighted engagement objectives met | - | Number of companies | 45 | Percentage | - |
Figure 1: The outcomes of three years of dialogue on climate
Figure 1: The outcomes of three years of dialogue on climate

Regional differences
Regional differences
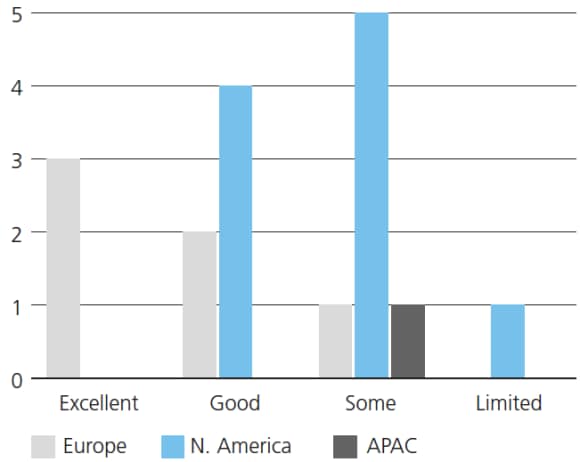
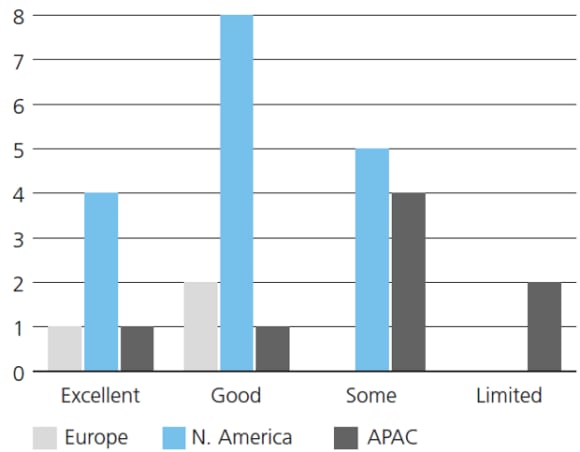
When looking at outcomes by the location of the companies in focus, we observed that oil and gas companies in Europe are leading their peers in other parts of the world. When looking at the utilities sector, the trend is different, and we noticed good progress from companies in the US driven by positive regulatory environments at the state level (see Figures 4 and 5).
Performance by sectors
Performance by sectors
When analyzing the results by sectors in focus, we observed that the utility sector is progressing more than the oil and gas sector. This is explained by the ability for the power sector to adapt more quickly by shifting the sources of energy used from fossil fuels to renewable energy. The oil and gas sector will take more time to be able to fully adapt business models to a low carbon economy.
Figure 2: Regional progress by oil and gas companies
Figure 2: Regional progress by oil and gas companies

Figure 3: Regional progress by utility companies
Figure 3: Regional progress by utility companies

We analyzed progress made by the companies in setting GHG emissions reduction targets. On a positive note, only one company on the list did not have any reduction target and more than half of the companies have set a net zero emissions by 2050 goal/ambition. However, we have looked at the quality of these targets and only 24% of these can be considered strong. Strong targets are short, mid and long term, are related to all material direct and indirect emissions (i.e., scope 1, 2 and 3) and cover all significant company operations/activities.
Figure 4: Quality of GHG emissions reduction targets
Figure 4: Quality of GHG emissions reduction targets

From a sector perspective, utility companies have shown a higher percentage of strong targets than oil and gas companies (see Figure 4).
When assessing the companies’ climate performance, we have taken into consideration current ambitions on increasing the exposure to renewable energy too.
Overall, 29 out of the 45 companies have set goals to increase either the percentage of energy capacity or the total gigawatts produced, or the amount of money invested in renewable energy.
However, in our view, more must be done by investors, companies and regulators to fill the gaps at the regional and sector level and to enable change at the pace required to achieve the Paris Agreement goals. We believe that the journey has only began. We are committed to expanding our efforts to engage with companies to play an important role in solving the current climate change emergency.
We believe that the positive outcomes achieved today have been made possible by collaboration among investors through CA100+, peer pressure in the industry, and positive regulatory trends in some parts of the world.
