Bond Bites: Off target
As the trajectory of inflation and interest rate hikes shows no sign of slowing down but growth remains muted, is there a deeper secular change on the horizon?
Key Highlights:
Key Highlights:
- Investors should expect the hawkish rhetoric from the Fed and more rate hikes to continue for some time yet given that US inflation is so far above target.
- Remarkably, monetary policy in the Eurozone has become pro-cyclical at a time of weakness in the broader economy.
- Lower trend growth in developed economies, high inflation and higher yields today could point to a deeper secular change in the global economy.
The so named Point Nemo in the South Pacific Ocean is the farthest possible point on Earth from land; the nearest landmass in any direction being at least 1,000 miles away. In fact, if you happen to find yourself there one day, your nearest human companions will be astronauts on the International Space Station orbiting 250 miles above your head. But I don’t recommend the trip. Its unique remoteness is the reason why space agencies around the world target Point Nemo for the fiery descent of redundant spaceships, satellites and assorted space-debris – the idea being that the risk posed to humans will be very low indeed. But I don’t envy the job of the NASA scientists who plot those trajectories. When you start with an object 250 miles above the earth which travels at 17,500 mph, even minor miscalculations have interesting consequences; get it right and your smoking space junk plummets harmlessly into the oubliette of the Pacific Ocean. Get it nano-fractions of a degree wrong and you send a streaking fireball crashing into the White House lawn1. Awkward.
The so-called soft landing
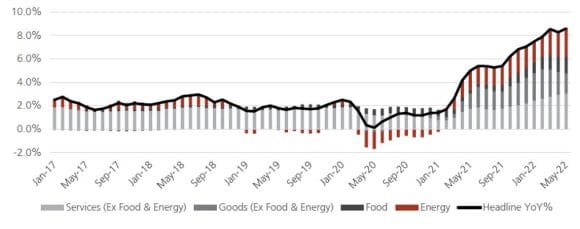
Musing on the idea of remote targets and the consequences of a bad miss, one may triangulate easily to the world of central banking. In the US, the May inflation report was unequivocally bad news for the Fed - and many investors. With headline inflation climbing back up to 8.6%, after a small dip in April, any hope that prices had already peaked was fatally wounded. The Fed has already moved rates 150 bps higher this year and – if current market pricing is right – will be tightening by another 175 bps in the remaining four meetings to the end of the year. Even that might not be enough if inflation does not soon trend meaningfully lower.
Chart 1 shows that, although the rate of increase in goods prices has indeed slowed a little, the rate in food, energy and, importantly now, services prices is still growing. In the near term, the outlook for food and energy prices are inextricably linked to the path of the war in the Ukraine (and these components have obvious spill-over effects into broader services prices). We can’t know for sure how that story will play out but there seems no reason to think the situation will ease any time soon. Already late in addressing rising inflation, the Fed’s credibility is well and truly at stake. So investors should expect the hawkish rhetoric and more rate hikes to continue for some time yet.
Chart 1: US CPI year-on-year
Chart 1: US CPI year-on-year

But the risks to the broader economy are very high indeed. Many of the factors driving prices higher today are so-called supply side factors that the Fed has no control over, and are not affected at all by monetary policy (Fed rate hikes do not alter the course of the war in the Ukraine sadly). Higher rates are intended to squeeze household spending lower and push down on private sector demand more broadly. The Fed thinks it can achieve this without triggering a recession – the so-called soft landing (or ‘softish’ as Jay Powell mused recently; but that qualifier already says a lot about their confidence levels).2
The jury is still out on the landing, but the omens are not good. Chart 2 shows that growth in the US already dipped into negative territory in Q1 this year – and while there might be some technical factors behind that – it is the case that growth in the US had already fallen back to its pre-pandemic level of around 2% by Q3 last year. This makes for a rather unusual backdrop to this tightening cycle; the typical central bank playbook envisages high inflation as accompanied by above trend growth, not at trend – or negative. And real household disposable income is already under pressure from higher inflation which will constrain spending, even before we consider the effect of rate hikes. In our June Investment Forum we weighed up all these complex interactions. For our global portfolios our conclusion was to remain short US duration (that means to position for higher yields, falling prices). In a nutshell, while US inflation is so far above target, we believe the Fed will be forced to keep moving rates higher. And all the time the Fed moves rates higher, bond yields are likely to follow.
Chart 2: US GDP change quarter on quarter
Chart 2: US GDP change quarter on quarter

For the time being it is the path of inflation that matters most – not the path of growth. So while some might look at the recent slowdown in GDP growth, weak equity markets and some other indicators, that might typically point to a growing recession these will not, in themselves, be enough to stay the Fed’s hand. With US headline inflation at 8.6% and rising we are unlikely to change our position until we are convinced the Fed has shifted the trajectory of inflation permanently back towards target.
An unstable trajectory in Europe
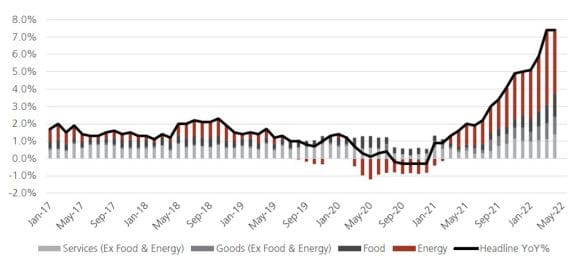
The European Central Bank (ECB) faces a horrible dilemma. Headline Euro Area CPI inflation recently hit 8% and price growth is dominated by energy inputs given the Eurozone’s high reliance on Russian gas and oil imports. Services inflation though is running at much lower levels than the US (see Chart 3) and seems less of a problem, while unemployment, although falling, is still nearly 7%. Despite this, high inflation today means the ECB was forced to commit to a much more hawkish policy stance at the June meeting, and to the extent that markets now price in nearly 1.75% of rate hikes by the end of the year. Given that policy rates have been negative since 2014, this is a stunning reversal. But again one cannot help but be struck how, like the US, monetary policy has become very pro-cyclical and tightening at a time of some apparent weakness in the broader economy - this is highly unusual.
Chart 3: Eurozone CPI year-on-year
Chart 3: Eurozone CPI year-on-year

A deeper, secular change?
Perhaps all this points to a deeper secular change. Several years ago Mervyn King – former Governor of the Bank of England described the time from the early 1990’s as NICE – Non-Inflationary Consistently Expansionary. One could say, in one way or another, the world stayed NICE for quite a long time after; low and stable inflation, mostly falling unemployment (give or take the odd financial crisis and global pandemic – well, that space-junk doesn’t always plop harmlessly into the ocean you know3) and strong financial markets.
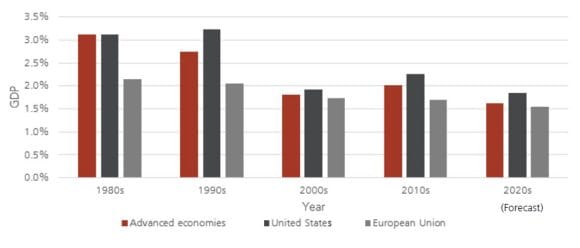
But the NICE party may now be over. It has been clear since the 1990s that global growth is steadily trending lower. Chart 4 shows the trend in the International Monetary Fund’s (IMF) developed market GDP growth data taken from the April 2022 World Economic Outlook (the 2020’s figure takes actual data for 2020 and 2021 with the IMF forecast projected to 2027) – so GDP growth which averaged 3.1% in the 1980s is now forecast at around 1.8% this decade. And at the same time, we experience the highest inflation prints for 40 years, while central banks implement ‘pro’ rather than ‘counter’-cyclical monetary policy manoeuvres. Low growth, high inflation, higher yields.
Chart 4: Regional GDP growth
Chart 4: Regional GDP growth

This will be a very bumpy re-entry indeed and to a world we may not even recognise.
To find out more about UBS AM’s fixed income offering,
Past performance is not a guide to future results
For further information please contact your client advisor. Investors should not base their investment decisions on this marketing material alone
For marketing and information purposes by UBS. Published June 2022. For professional clients / qualified / institutional investors only.
This document does not replace portfolio and fund-specific materials. Commentary is at a macro or strategy level and is not with reference to any registered or other mutual fund.
About the author

Jonathan Gregory
Head Fixed Income UK, UBS-AM
Make an inquiry
Fill in an inquiry form and leave your details – we’ll be back in touch.
Introducing our leadership team
Meet the members of the team responsible for UBS Asset Management’s strategic direction.

