Multilateral Development Bank Bonds an impact investment with defensive properties

Bonds of Multilateral Development Banks offer a unique sustainable investment opportunity in high-grade USD denominated debt. Thanks to their negative correlation to equities and very high credit rating, they represent a liquid low-risk form of impact investing. We will showcase how they can play a defensive role in investors’ portfolios and provide a viable alternative to US Treasuries.
What are Multilateral Development Banks?
What are Multilateral Development Banks?
Multilateral Development Banks (MDBs) are supranational financial institutions dedicated to providing financing and know-how for economic and social development projects. They were founded by sovereign states which contribute capital and provide guarantees allowing MDBs to raise funds in international capital markets at attractive rates. Given that MDBs are non-profit organizations, they are then able to provide loans to less developed countries at attractive conditions.
The example of the International Bank for Reconstruction and Development (IBRD)
The example of the International Bank for Reconstruction and Development (IBRD)
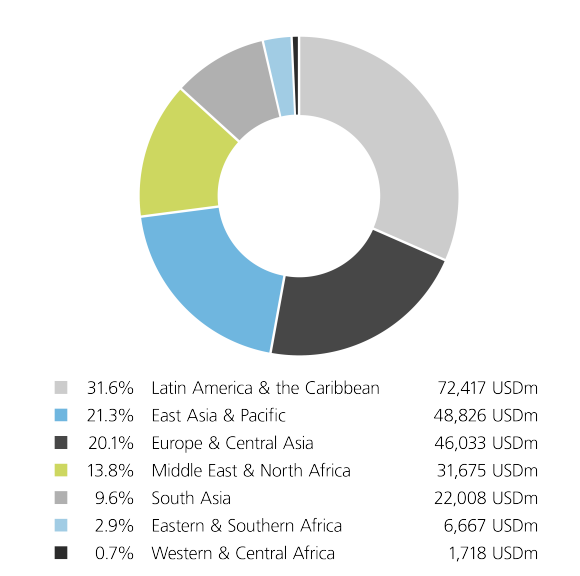
The IBRD, which is part of the World Bank Group, is the oldest multilateral development bank. It was created in 1944 to finance reconstruction of Europe after World War II. Over time, its mandate has been expanded to help promote economic development and to help eradicate poverty globally. Eligible borrowers include creditworthy low- and middle-income countries with a gross national income per person of at least USD 1255 as of July 2022 (IBRD 2022). Currently, the IBRD has outstanding loans and commitments totaling USD 229.3bn with the largest concentration being in Latin America & the Caribbean at 31.6% followed by East Asia & Pacific at 21.3%, see Figure 1 (IBRD 2022).
Figure 1: Geographic concentration of IRBD commitments
The projects vary by type with ‘Creation of Physical and Social Infrastructure’ being the largest category repre¬senting 42% of allocated resources closely followed by ‘Support for achieving sustainable policy’ with 40%, see Figure 2 (IBRD 2022). These projects involve creating physical and social infrastructure, such as roads, schools, hospitals, etc., as well as endorsing policies that strengthen public institutions with the overarching goal of promoting sustainable development (see Figure 3 for examples). Overall, the IBRD is committed to supporting the realization of the UN’s Sustainable Development Goals (SGDs).
Figure 2: Distribution on funding between main types of IBRD projects
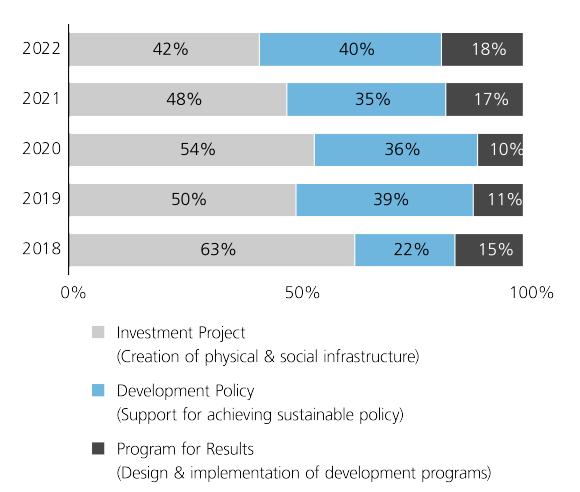
Figure 3: Examples of projects financed by IBRD
Country | Country | Project | Project | Description | Description | Commitment | Commitment | Type | Type |
|---|---|---|---|---|---|---|---|---|---|
Country | Mongolia | Project | Ulaanbaatar Sustainable Urban Transport Project | Description | Developing a comprehensive framework for sustainable urban mobility in Ulaanbaatar, reducing congestion, improving road safety, and addressing climate resilience on selected transport corridors | Commitment | USD 100 m | Type | Creation of physical & social infrastructure |
Country | Angola | Project | Climate Resilience and Water Security in Angola | Description | Improving water supply services and strengthening water resources management for climate resilience in selected areas in the Angolan territory | Commitment | USD 300 m | Type | Creation of physical & social infrastructure |
Country | Colombia | Project | Equitable and Green Recovery | Description | Supporting measures that reduce income inequalities (including gender-related) and build resilience, (ii) promote economy-wide decarbonization and climate adaptation, and (iii) mitigate climate change by protecting biodiversity and reducing deforestation | Commitment | USD 750 m | Type | Support for achieving sustainable policy |
MDBs as a sustainable, impact investment
MDBs as a sustainable, impact investment
MDBs are backed by multiple sovereign member nations (including all G7 countries) which, in addition to their unique capital structure, allows them to receive a very high credit rating (usually AAA) from various credit rating insti¬tutions. Thanks to their high credit quality, MDBs can issue bonds at low interest yields close to that of the highest rated sovereigns and use the proceeds to make loans for projects in developing countries. Since MDBs lend at substantially discounted interest or provide grants to fund projects, they allow borrowers from developing countries to access credit at much more favorable conditions than those faced if they would borrow directly from private lenders.
MDBs lend mainly to lower-middle and middle income developing countries, and hence they contribute to the economic development of these regions. Other sources of financial and technical assistance have emerged in recent years in the form of foundations, Non-Governmental-Organizations (NGOs) and other multilateral organizations, yet MDBs remain a vital piece of the international assistance mecha¬nism given their scale and reach.
Most MDBs are active across all 17 of the UN Sustainable Goals (SDGs), and most projects and programs support multiple SDGs simultaneously. Looking at the “World Bank Group Annual Report 2021” we can see some recent examples of the types of impact projects that were financed by the World Bank Group:
- Respond to the COVID-19 Health Crisis & Partnering on Vaccines
- Investments in Climate Change
- Reduction of Countries’ Unsustainable Debt Burdens
- Protecting Food Security by helping governments build robust and sustainable food systems
- Addressing the Global Learning Crisis (the World Bank is the largest source of external financing for education in developing countries)
- Boosting Social Protection Coverage
- Closing the Gender Gap
- Supporting over 30 Fragile and Conflict-affected Countries to address the COVID-19 Pandemic’s Impacts
Even though the proceeds of each MDB bond cannot be directly allocated to a specific project, the issuer institution is very transparent and discloses publicly every project’s progress, outcome and ultimate impact.
How do you create a MDB index?
How do you create a MDB index?
Traditional bond indices typically contain only a small amount of highly-rated sustainable debt. In order to increase their allocation to sustainable debt, clients should invest in dedicated solutions that explicitly focus on these types of securities. One way to invest in this segment is through passive solutions, such as the one created by the collaboration between Solactive and UBS: the Solactive Global Multilateral Development Bank Bond USD 25% Issuer Capped Index.
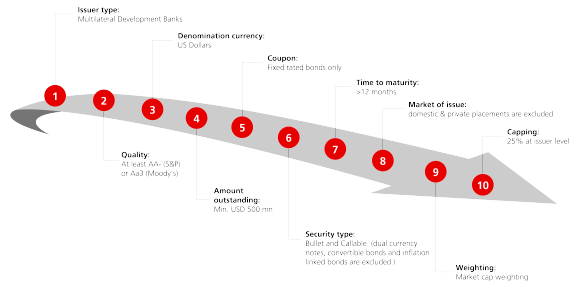
The index is designed to capture a representation of bonds issued by the largest MDBs that have all G7 countries as members. In Figure 4 we highlight some key features of the index methodology; firstly, only highly-rated bonds are eligible. Secondly, it includes only USD denominated fixed-rate securities with a time to maturity no less than 12 months. Thirdly, to ensure liquidity, only large bond issues are eligible (min. USD 500 m). Finally, the index is market cap weighted with an issuer cap of 25% to enhance diversification.
The index constituents include bonds from five different organizations as of August 2022:
- World Bank Group comprising of the International Bank for Reconstruction and Development (IBRD), the International Finance Corporation (IFC) and the International Development Association (IDA)
- Inter-American Development Bank
- Asian Development Bank
- European Bank for Reconstruction & Development
- African Development Bank
Each of the selected multilateral banks have a track record of robust performance, solid reputation, and play an important role in their respective regions.¹ The weights of bonds issued by the World Bank, Asian Development Bank and Inter-American Bank are all at the maximum level of 25%. Overall, the index holds 97 different bonds with their individual weights ranging from 0.16% to 3.94% (August 2022).
Figure 4: Index Construction
What is the investment rationale?
What is the investment rationale?
All constituents of the Solactive Global Multilateral Develop¬ment Bank Bond USD 25% Issuer Capped Index are rated AAA by S&P, Moody’s and Fitch (as of September 2022). This exposure can therefore be seen as a ‘sustainable alter¬native’ to high grade USD denominated sovereign debt, while also being an impact investment. It provides a certain amount of yield enhancement over duration-matched US Treasuries. Furthermore, MDBs have strong guarantees by G7 countries and other highly-rated sovereigns. In terms of risk assessment, it is noteworthy that no major MDB has ever defaulted in their history (UBS Asset Management, September 2022).
What is the rationale behind the AAA rating?
What is the rationale behind the AAA rating?
Multilateral Development Banks provide loans to less developed countries at very low rates of interest, so they enjoy minimal margins compared to their rate of financing. An important aspect making it possible is the so-called ‘preferred creditor’ status of MDBs, which gives them priority over all other creditors. Borrowing members promise to prioritize payments to MDBs over bilateral sovereign creditors and over loans taken from the markets.²
In addition, MDBs have strong fundamental credit positions. For example, Moody’s points out that IBRD credit strength is due to: “1) high capital adequacy, supported by a robust risk management framework and preferred creditor status that contributes to very strong asset performance; 2) ample liquidity buffers and exceptional access to global funding markets; and 3) a large cushion of callable capital and very high willingness and ability of global shareholders to provide support” (Moody’s 2022).
The MDBs also have a low percentage of non-performing assets (NPA). For example, the IBRD had an NPA of just around 0.2% in 2021 (Moody’s 2022). The value would be likely higher in absence of the benefit of preferred creditor status. Moreover, the IBRD has more than full coverage (107%) of its debt outstanding from callable member capital which are predominantly highly rated sovereigns (Moody’s 2022).
Which characteristics does the index display?
Which characteristics does the index display?
In Figure 5 we show the historical Yield and Option-Adjusted Spread (OAS) characteristics of the MDB Index since inception (2011).
Looking at the Yield-to-Maturity (YTM) evolution over time, we can see that the MDB Index is strongly connected to the monetary policy actions followed by global central banks, particular by the US Federal Reserve. This helps us to understand the recent sharp move upward of YTM for MDBs, which is linked to the monetary policy tightening implemented by several central banks to achieve their price stability objectives.
Figure 5 also shows that, thanks to their very low default risks and reasonably high market liquidity, MDB bonds only have a modest spread above US Treasuries. Interestingly, even though YTM increased substantially in the last year, the levels of Option-adjusted Spread (OAS) remained low. As of end-August 2022, the OAS offered on top of US Duration Matched Treasuries stands at 12bps, which is below the historical average of 16bps.
At times of high market stress, MDB bond spreads widen temporarily, mainly because of worsening liquidity conditions. In the chart we can see two main such episodes: the Euro Debt crisis in early 2012 (where OAS peaked at 40bps), and the Covid crisis (OAS peaked at 54bps). It is interesting to see how these phases tend to be usually brief, with spreads reverting quickly and price losses being temporary and fully recouped as market conditions normalized.
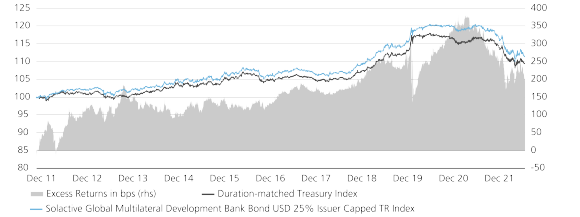
The additional yield of MDBs can be seen as a compensation for the slightly lower liquidity that MDBs offer relative to US Treasuries. Over long-periods, the yield premium has helped to achieve greater returns while keeping a risk-return profile very similar to a portfolio of duration-matched US Treasuries. As shown in Figure 6, the excess returns since inception stands at approximately 220bps.
Figure 5: MDB Spreads remain tight
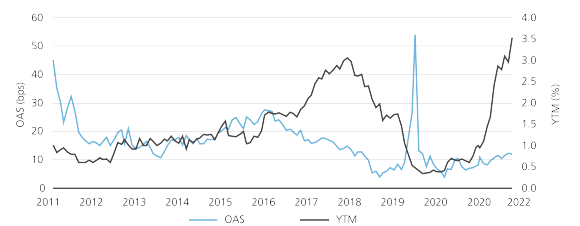
Figure 6: Long run total return comparison
What is the role of MDBs in an investment portfolio?
What is the role of MDBs in an investment portfolio?
As shown in the previous section, MDB Index risk-return characteristics are very much in line with those of US Treasuries. This, paired with the high credit quality (AAA-rated), confirms that MDB bonds belong to the safest component of asset allocation (alongside other government-related bonds).
Since the role of the safest part of the portfolio is to diversify and offer protection during periods of high (equity) market stress, we expect MDB price dynamics to be unrelated to movements in the equity market. Figure 7 confirms that, if we take the MSCI ACWI Index as a proxy for the broad equity market, we can see how both our MDB Index and a US Duration-Matched Treasury Index, showed negative correlation in daily returns from the end of 2011 until today.
Thanks to their generally low or negative correlation to equities, their prices tend to remain stable, or even go up, when equity prices fall. As a such, the main role of MDB in a portfolio is to diversify and offer protection during periods of high (equity) market stress.
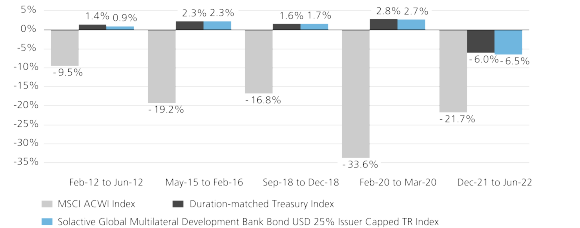
In order to understand how this negative correlation has played out in some historic market sell-off events, in Figure 8 we have isolated five major global equity market corrections for the MSCI ACWI (since inception of the MDB Index in 2011). The chart highlights how MDB bonds have achieved moderately positive returns during four out of five episodes, confirming its diversification properties. One of the most prominent example being the 2020 covid-crisis where, opposed to the -33% of MSCI ACWI, the MDB Index had a +2.7% return.
Out of the five cases, the only example where, during the equity market sell-off, MDB performed negatively has been 2022. The main reason for this exception is that in 2022, the equity drawdown coincided with a global monetary policy tightening (rate hiking cycle). Intuitively, because of interest rate risk, when market interest rates rise the prices of fixed-rate bonds fall, causing negative returns. This explains why, along with MSCI ACWI, both the MDB Index and US Duration-Matched Treasuries performed negatively during the period.
Besides the recent negative performance, the chart showcases how the MDB index performed broadly in line with US Duration-Matched Treasuries even during market-stress periods. This confirms that MDB have similar risk-return characteristics to US Treasury, and therefore belongs to the safest component of the Asset Allocation.
Figure 7: Negative correlation with MSCI ACWI
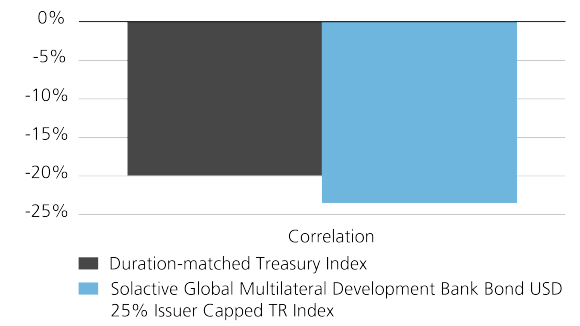
Figure 8: Performance in equity drawndown periods
Literature
Literature
Make an inquiry
Fill in an inquiry form and leave your details – we’ll be back in touch.
Introducing our leadership team
Meet the members of the team responsible for UBS Asset Management’s strategic direction.


