Looking ahead
Intermediate projections of the economy and capital markets – five-year outlook from 2020 to 2025
UBS Asset Management Investment Solutions
UBS Asset Management Investment Solutions

Our five-year (2020-2025) expectations in brief
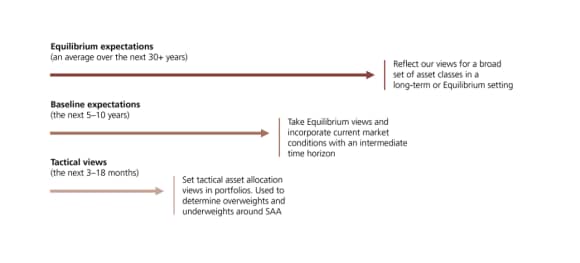
UBS Asset Management’s Investment Solutions team conducts ongoing macroeconomic research to develop our baseline five- and 10-year return expectations. Drawing on the breadth and depth of expertise provided by more than 100 professionals and an over-36-year asset management track record, our capital market expectations quantify risk/return expectations for a broad set of asset classes, incorporate current market and economic conditions and provide a key component for modeling a portfolio’s strategic asset allocation.
Our last publication highlighted our June 2019 assumptions. Since then, equities ended the decade with an admirable 10-year record and momentum continued with new highs into February.
Then the pandemic hit and the equity markets dropped more than 30% before rallying sharply. Government bond yields across all maturities declined in the US--which lowered expected return in local terms. Credit markets have had surprising ups and downs, but are still at relatively wide levels going into the end of May.
The main updates in our five-year capital market assumptions compared to our mid-2019 report are:
- Expected equity returns in nominal terms are higher, as valuation is improved.
- Government bond yields are even lower, so expected returns are lower. European yields did not drop as much as US yields, but were lower to start with.
- In general, we lowered expected 10-year yields in developed countries in 2025 by 0.4% to 1.1%. This has offset some of the drop in yields in projected returns.
- Credit spreads are higher due to higher default risks, but returns are more attractive relative to governments. They bottomed out in early January 2020 before ballooning late in the first quarter of 2020. They tightened significantly in April and into May.
- The dollar appreciated against most, but not all currencies. Emerging markets had extremely large depreciations (Brazil -29.2% for example). In general, we view the dollar as overvalued against both developed market and emerging market currencies.

Our approach to capital market assumptions
Capital market assumptions (CMA) are critical inputs in designing an investment strategy that will help investors meet specific objectives. A pension plan, for example, has liabilities with certain wage, payout and inflation assumptions; an endowment may plan for distributions based on university budget growth; or a family office may have income and real growth objectives. Ultimately, the CMEs must have an economic logic and consistency behind them that tie into the larger setting that investors face.
Make an inquiry
Fill in an inquiry form and leave your details – we’ll be back in touch.
Introducing our leadership team
Meet the members of the team responsible for UBS Asset Management’s strategic direction.
