The income challenge
Central banks have driven interest rates lower in an effort to boost an economic recovery during the pandemic. But can investors find answers in their search for yield within diversified multi-asset portfolios?
24 Nov 2020
4 min read

Nicole Goldberger
Head of Growth Portfolios, Investment Solutions

Lou Finney
Co-Head of Strategic Asset Allocation Modeling

Michele Gambera
Co-Head of Strategic Asset Allocation Modeling
The multi-decade decline in bond yields across advanced economies has cultivated a new conundrum for investors: there is no longer such a thing as a positive risk-free real return, ex ante. As the desire for income generation has not waned, these circumstances have meant it is necessary to think differently when looking at the investment offerings required to meet these needs.
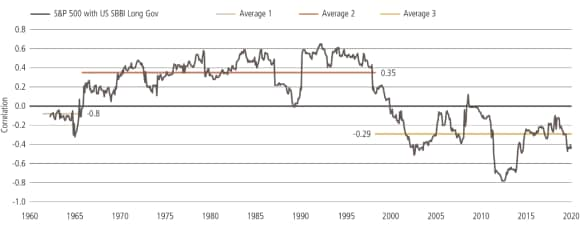
Adding to this challenge is the potential that government bonds will be hard- pressed to deliver the same degree of diversification benefits seen in the past two decades, in which they displayed a robust negative correlation with equity markets. This combination allowed for simple, traditional portfolio structures to have lower volatility which in turn increases the geometric return.
With interest rates essentially at this lower bound, this relationship has the potential to become less robust and reliable over time. In the short run over the next few quarters, we expect the negative relationship of 2020 to persist. As the economy continues to recover, we believe that equity prices should move upward and interest rates should gradually increase. Conversely, should another shock occur, we see US 10-year rates potentially declining all the way down to 0.2% and expect US long bonds in particular to provide some type of hedge in sell-offs.
Stock-bond correlation of nominal total returns
Stock-bond correlation of nominal total returns
Rolling 36 Month Values: S&P 500 with US SBBI Long Gov

A sustained acceleration in inflation that pushes the stock-bond correlation into positive territory is the biggest risk to traditional portfolios that use bonds as their primary hedge against drawdowns in equities.
A more likely risk to portfolios is that the low level of US interest rates and proximity to the zero lower bound results in a stock-bond correlation that edges closer to zero, setting up a situation in which this “safe” asset provides neither meaningful yield nor sufficient diversification.
Alternative assets can provide diversification
Alternative assets can provide diversification
Today’s market realities highlight the need for a more flexible multi-asset mindset to capture higher income opportunities. We recommend the incorporation of alternative diversifiers to build multi-asset portfolios, particularly private markets if you are able to relax the liquidity constraint (and meet the investor requirements of these private funds). Illiquid alternatives – private equity, property, hedge funds and infrastructure – provide not only diversification benefits, but can be structured to produce attractive, though variable, income.
By and large, alternatives have delivered compelling risk-adjusted returns and can help investors build better portfolios. Private equity has median internal rates of return above public equities over the long term; unlevered real estate looks to be between stock and bonds; and private debt markets have IRRs slightly above high yield returns.1 While alternatives are not immune to the pressures of a low yield world, we expect their return premium relative to other risk assets to persist going forward.
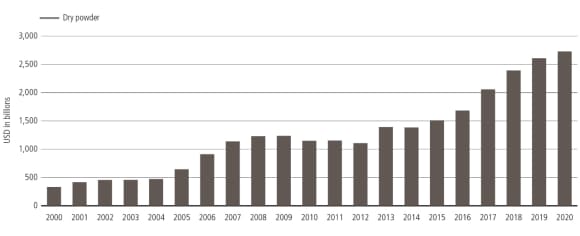
Dry powder (uncalled but committed capital) in USD bn

Increased capital in private equity
Increased capital in private equity
There is already a significant amount of capital flowing into private equity, which covers a large number of strategies and niche markets, broadly broken into three categories: growth/ return-oriented strategies, debt strategies, and natural resource strategies. Public pension plans, endowments and sovereign wealth funds are expanding their allocations to alternatives. Total dry powder – the amount of uncalled, but committed capital – is now over $2.5 trillion, up over $1 trillion in the last four years.
Real estate investments historically have provided stable income returns over time, while also acting as a risk reducer in portfolios given their low volatility and low correlations to traditional asset classes. Consequently, we expect steady returns in the mid-single digits for unlevered property, with the majority of the return coming from income as well as modest capital appreciation. Another benefit of real estate is that it can act as an inflation hedge. Should inflation rise consistently above 2%, we expect real estate to perform well relative to other asset classes.
Private infrastructure - income
Private infrastructure - income
Private infrastructure has provided a stable source of income, while it is also prized for its low historical correlations to traditional markets. Infrastructure, like private equity, is a cash flow investment strategy, but there are substantive differences in the type of investment, payout period, and expected performance that is distinguished from ‘traditional’ private equity. Moreover, infrastructure is fundamentally different in they are always physical, capital intensive projects, not software or services. They have large up-front capital costs, longer but steadier payout periods, and an element of government involvement because of the public nature of the investment. In a sense, they are a ‘low beta’ private equity investment.
Given the demand for private infrastructure investments in a post COVID-19 world, we believe that this is an area that will likely remain resilient and attractive to investors moving forward.
After a torrid 1990s and 2000s, the returns of hedge funds in the 2010s dipped into mid-single digits. We would expect similar modest future returns, but their attractiveness as a diversifier and a source of asymmetric returns should remain. Well-constructed hedge fund portfolios have historically offered low beta exposure to equity and fixed income markets and consequently deserve strong consideration in portfolios.
Risk and return: Historic and prospective2
Public assets | Public assets | Historic 10-yr Performance (%) | Historic 10-yr Performance (%) | UBS’s expected 5-yr Performance (%)3 | UBS’s expected 5-yr Performance (%)3 |
|---|---|---|---|---|---|
Public assets | Global Equities-Unhedged | Historic 10-yr Performance (%) | 8.5 | UBS’s expected 5-yr Performance (%)3 | 7.2 |
Public assets | Global Aggregate IG Fixed Income-Hedged | Historic 10-yr Performance (%) | 3.9 | UBS’s expected 5-yr Performance (%)3 | 0.2 |
Public assets | US Cash | Historic 10-yr Performance (%) | 0.6 | UBS’s expected 5-yr Performance (%)3 | 0.3 |
Alternatives | Alternatives | Historic 10-yr Performance (%) | Historic 10-yr Performance (%) | UBS’s expected 5-yr Performance (%)3 | UBS’s expected 5-yr Performance (%)3 |
|---|---|---|---|---|---|
Alternatives | Private Equity - US | Historic 10-yr Performance (%) | 12.2 | UBS’s expected 5-yr Performance (%)3 | 8.2 |
Alternatives | Private Equity - Global | Historic 10-yr Performance (%) | 12.2 | UBS’s expected 5-yr Performance (%)3 | 9.5 |
Alternatives | Global Real Estate - Unlevered Property | Historic 10-yr Performance (%) | 9.7 | UBS’s expected 5-yr Performance (%)3 | 5.8 |
Alternatives | Global Real Estate - Core Funds | Historic 10-yr Performance (%) | 10.8 | UBS’s expected 5-yr Performance (%)3 | 6.2 |
Alternatives | Global Real Estate - Value-Added/Opportunistic Funds | Historic 10-yr Performance (%) | 14.1 | UBS’s expected 5-yr Performance (%)3 | 6.7 |
Alternatives | Hedge Funds - Low Volatility | Historic 10-yr Performance (%) | 3.6 | UBS’s expected 5-yr Performance (%)3 | 4.0 |
Alternatives | Hedge Funds - High Volatility | Historic 10-yr Performance (%) | 3.6 | UBS’s expected 5-yr Performance (%)3 | 4.7 |
Alternatives | Global Infrastructure | Historic 10-yr Performance (%) | 10.3 | UBS’s expected 5-yr Performance (%)3 | 6.2 |
